 1 / 11
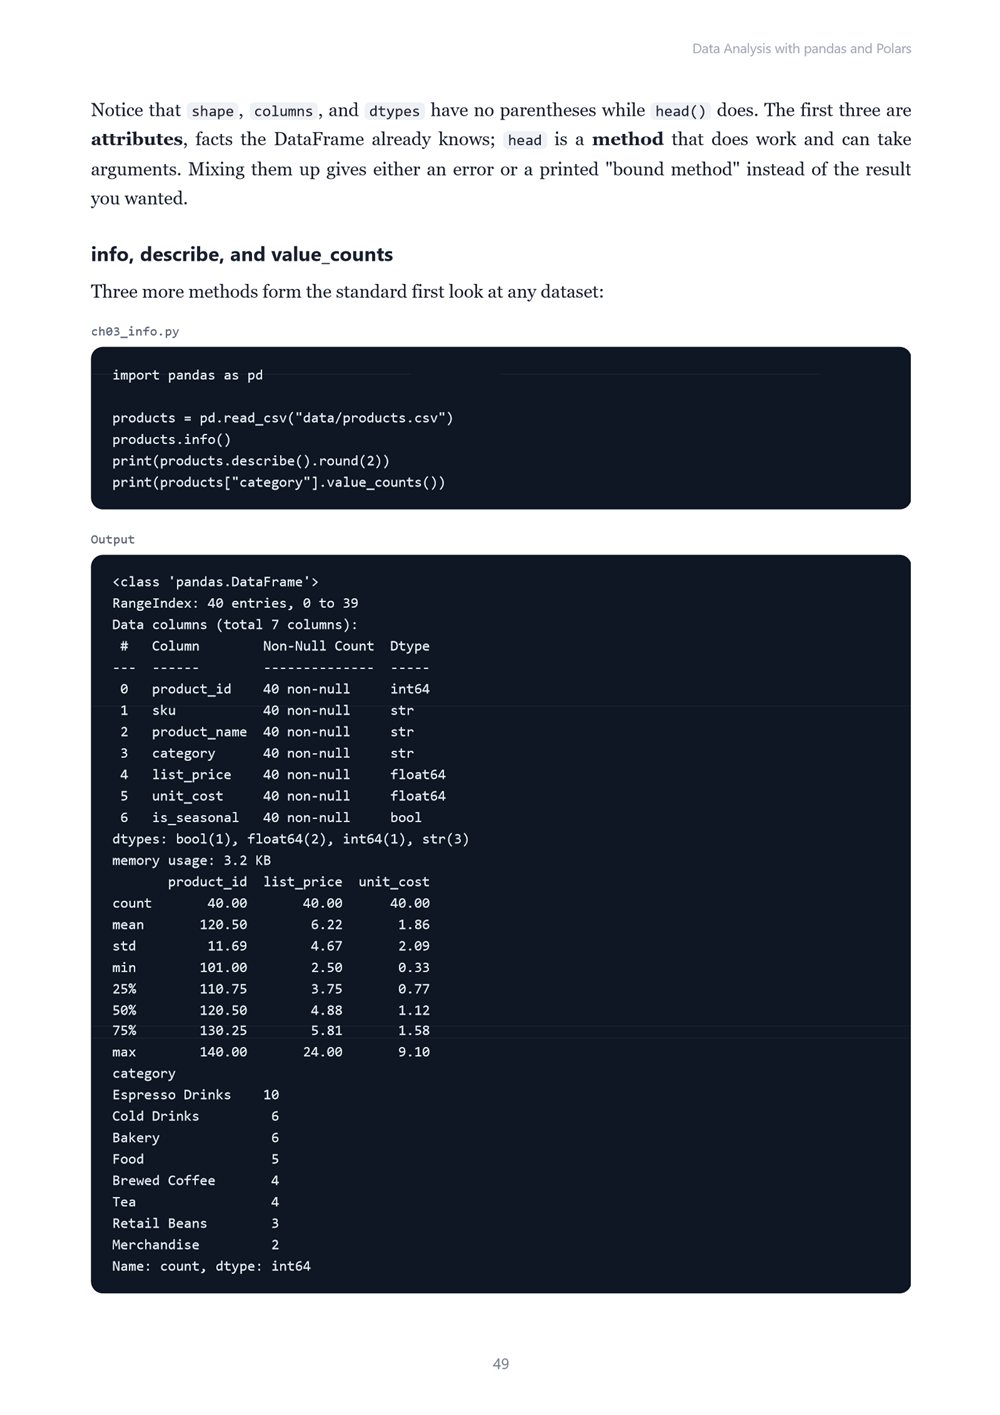
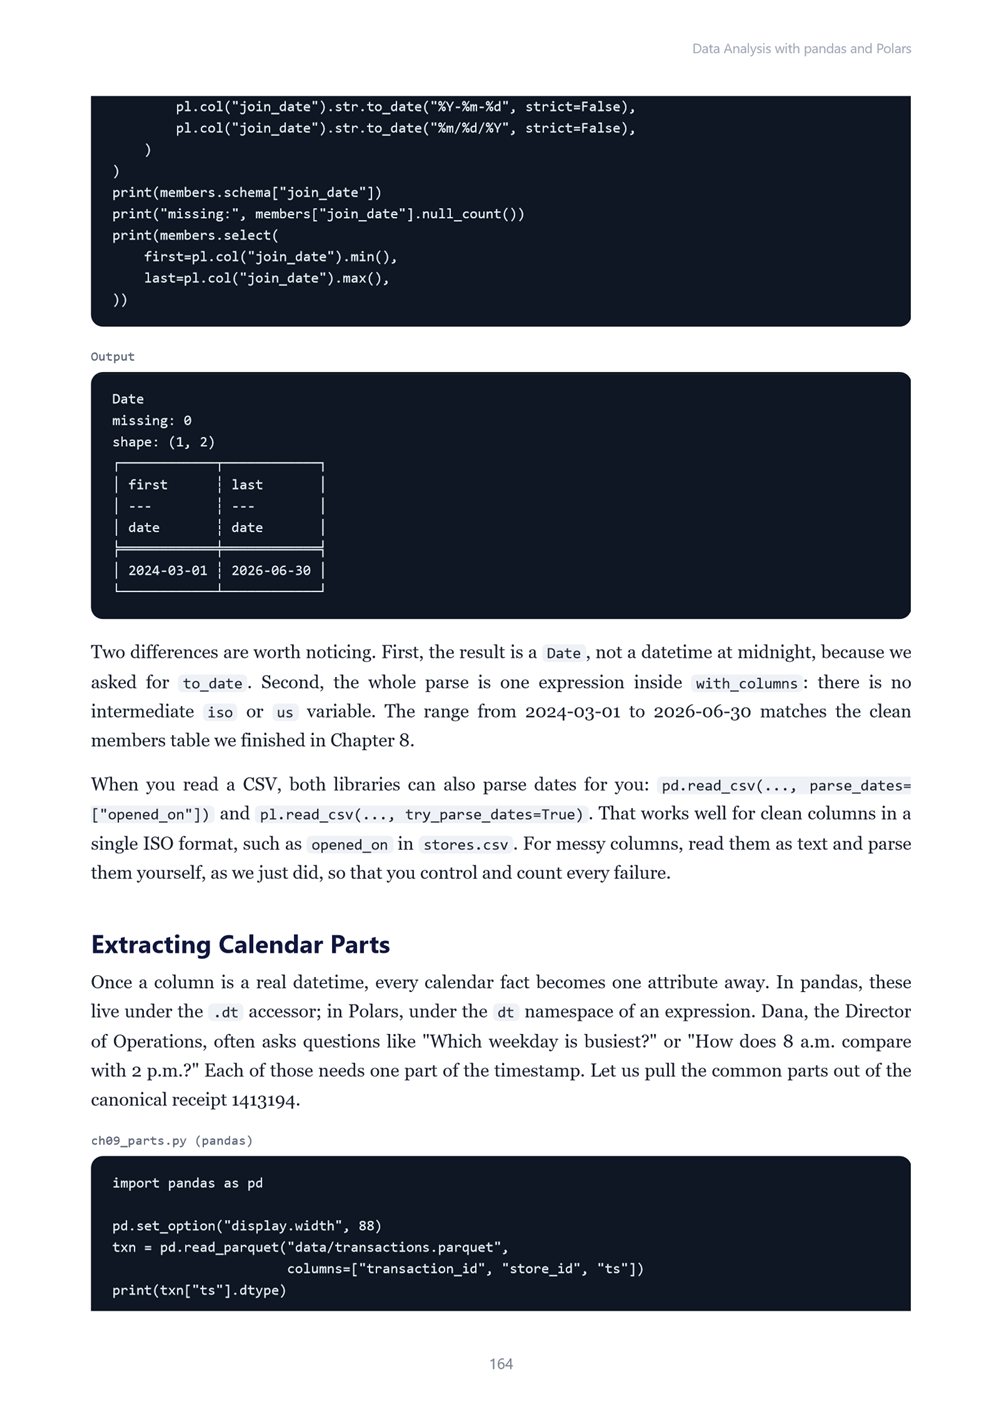
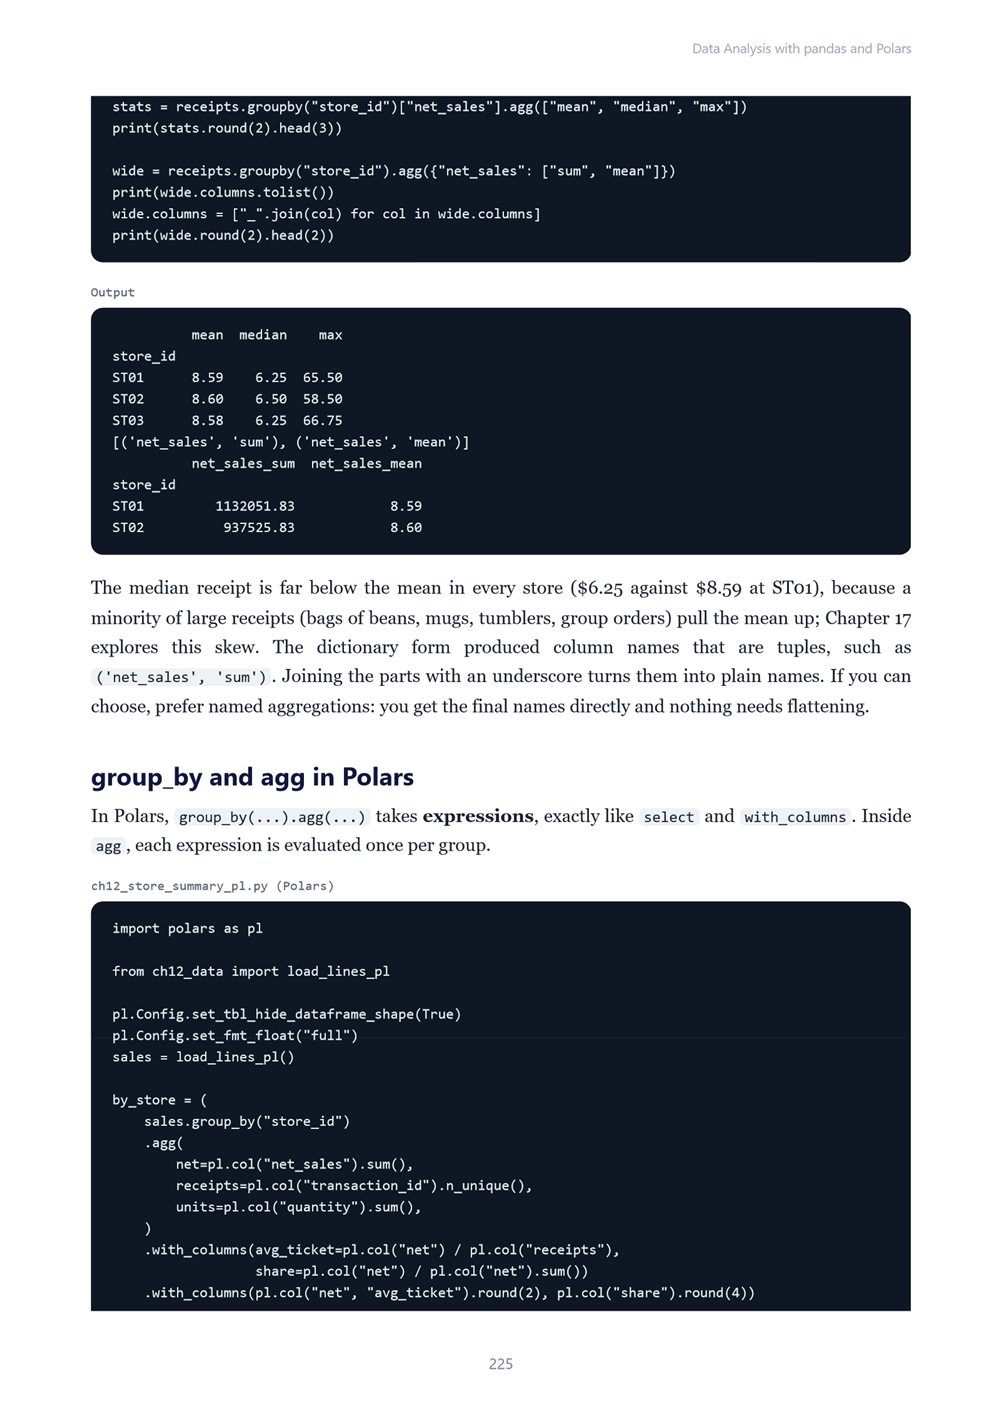
Learn practical data analysis in Python with pandas and Polars side by side: setup, Series and DataFrames, expressions and lazy queries, CSV, Parquet, JSON, Excel, and databases, filtering, cleaning messy files, text and categories, dates and time zones, data validation and reconciliation, new…
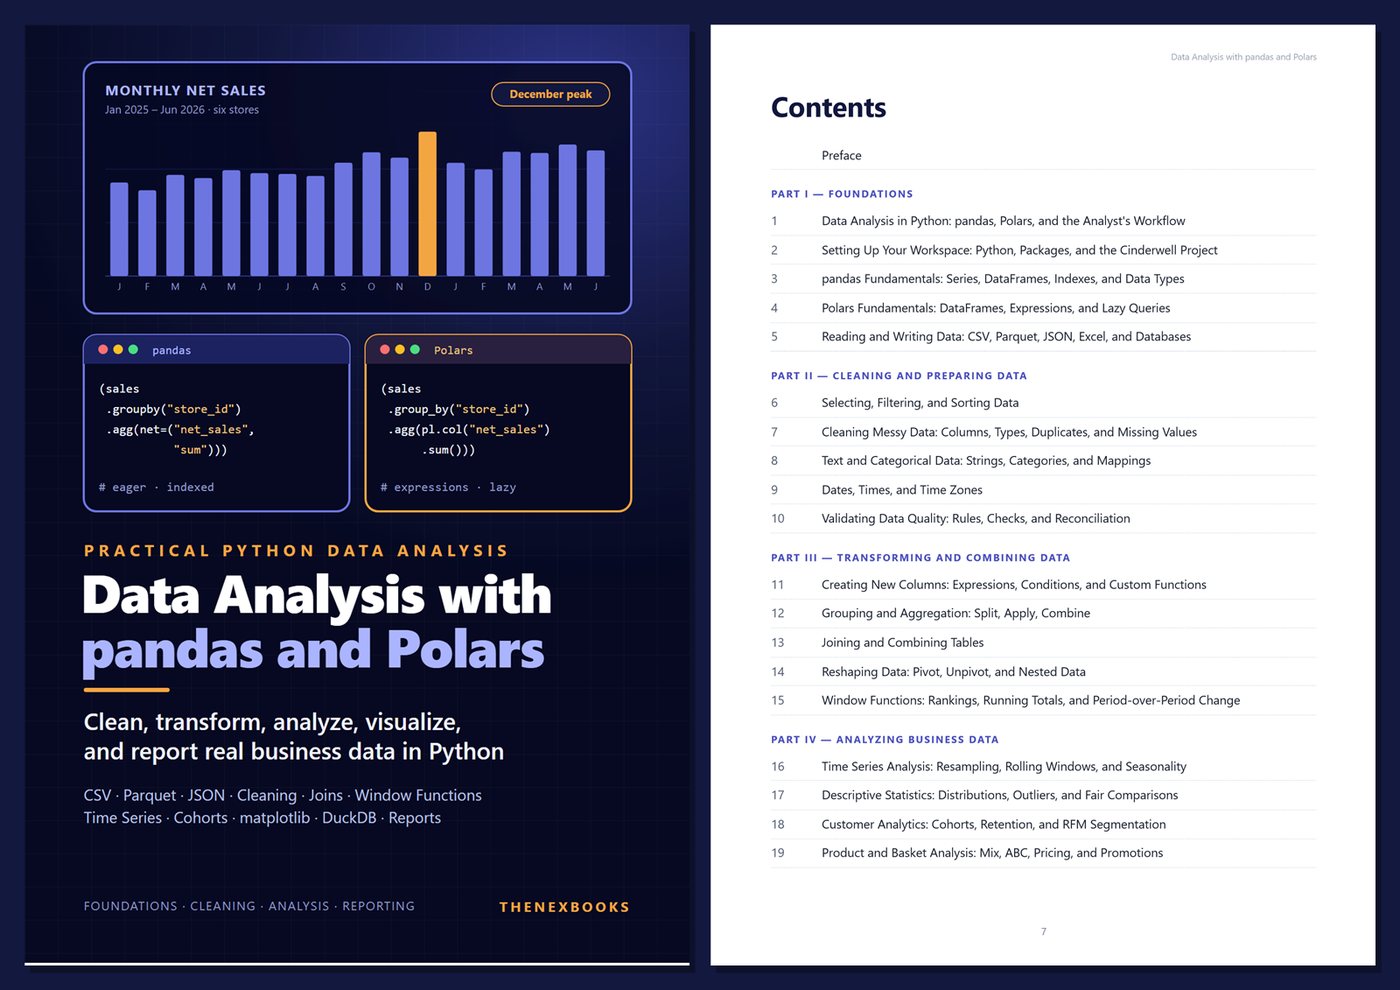
Clean, Transform, Analyze, Visualize, and Report Real Business Data in Python
Read before you buy: the PDF here is a free sample — the first 20 pages of the 572-page book (payments, sales and reviews on this demo site are sample data). Get the full e-book at thenexbooks on Gumroad.
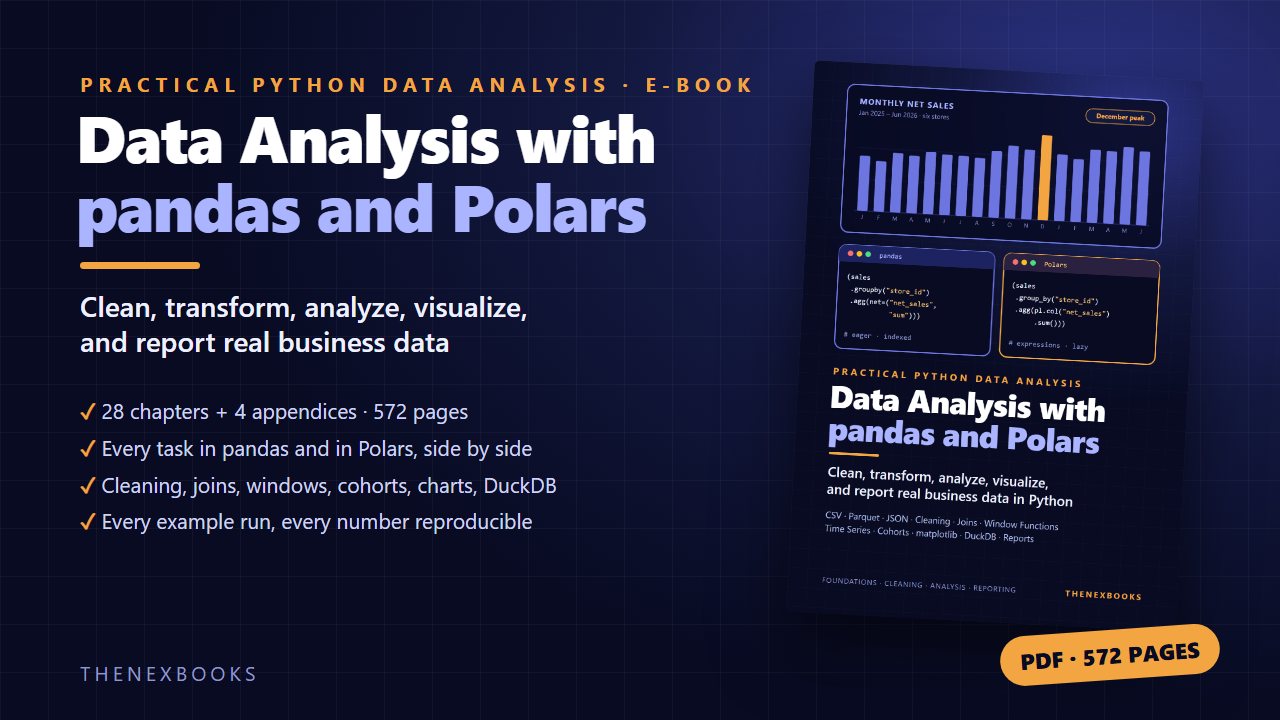
Turn messy business data into numbers you can trust — and reports people can act on — with pandas and Polars.
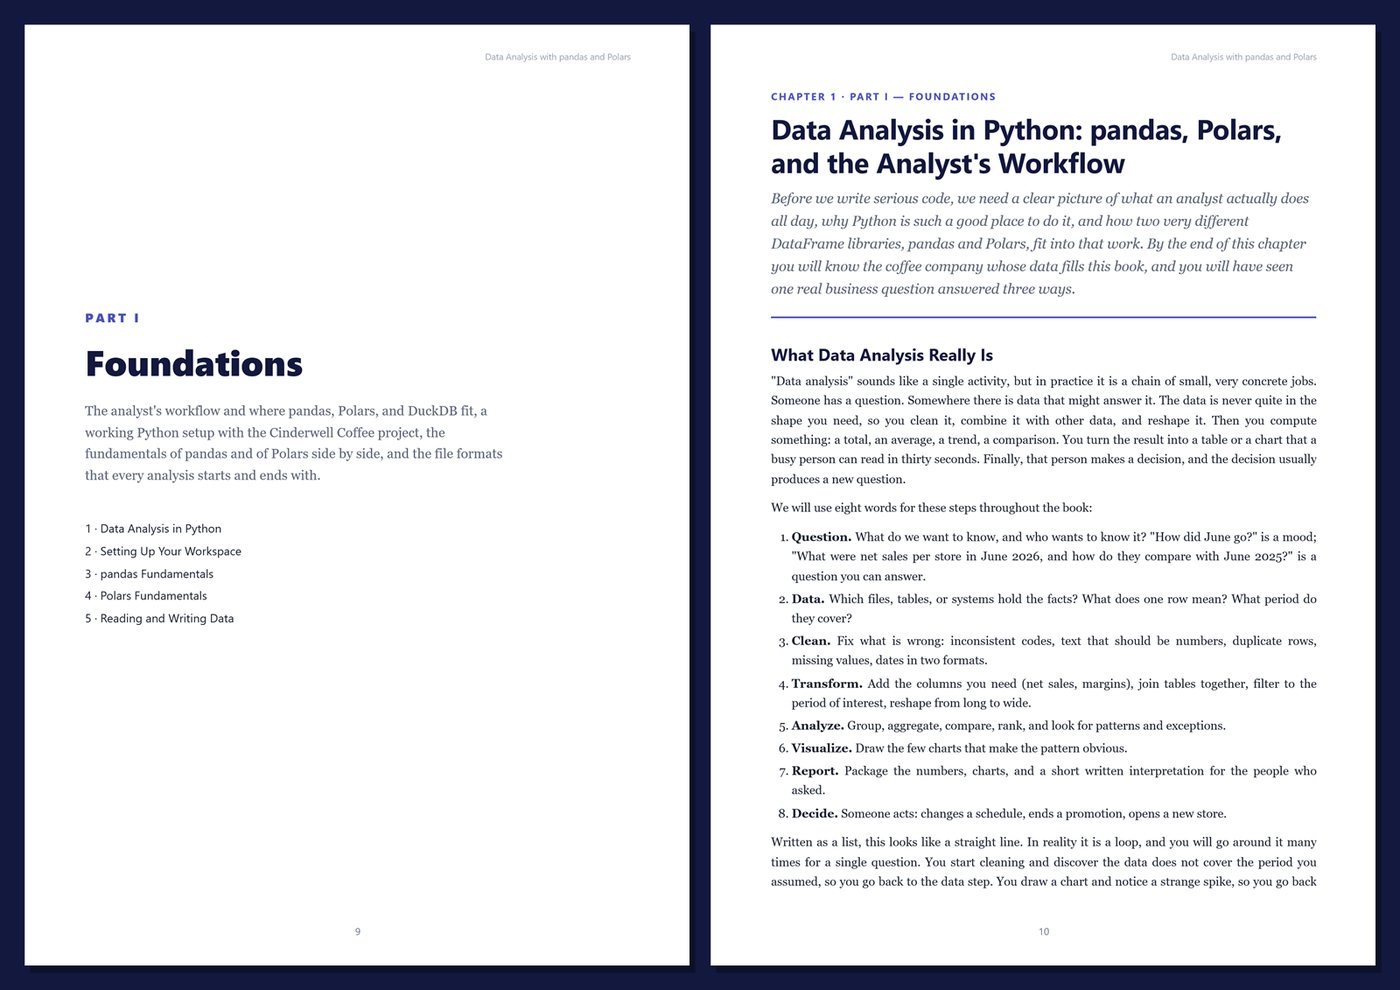
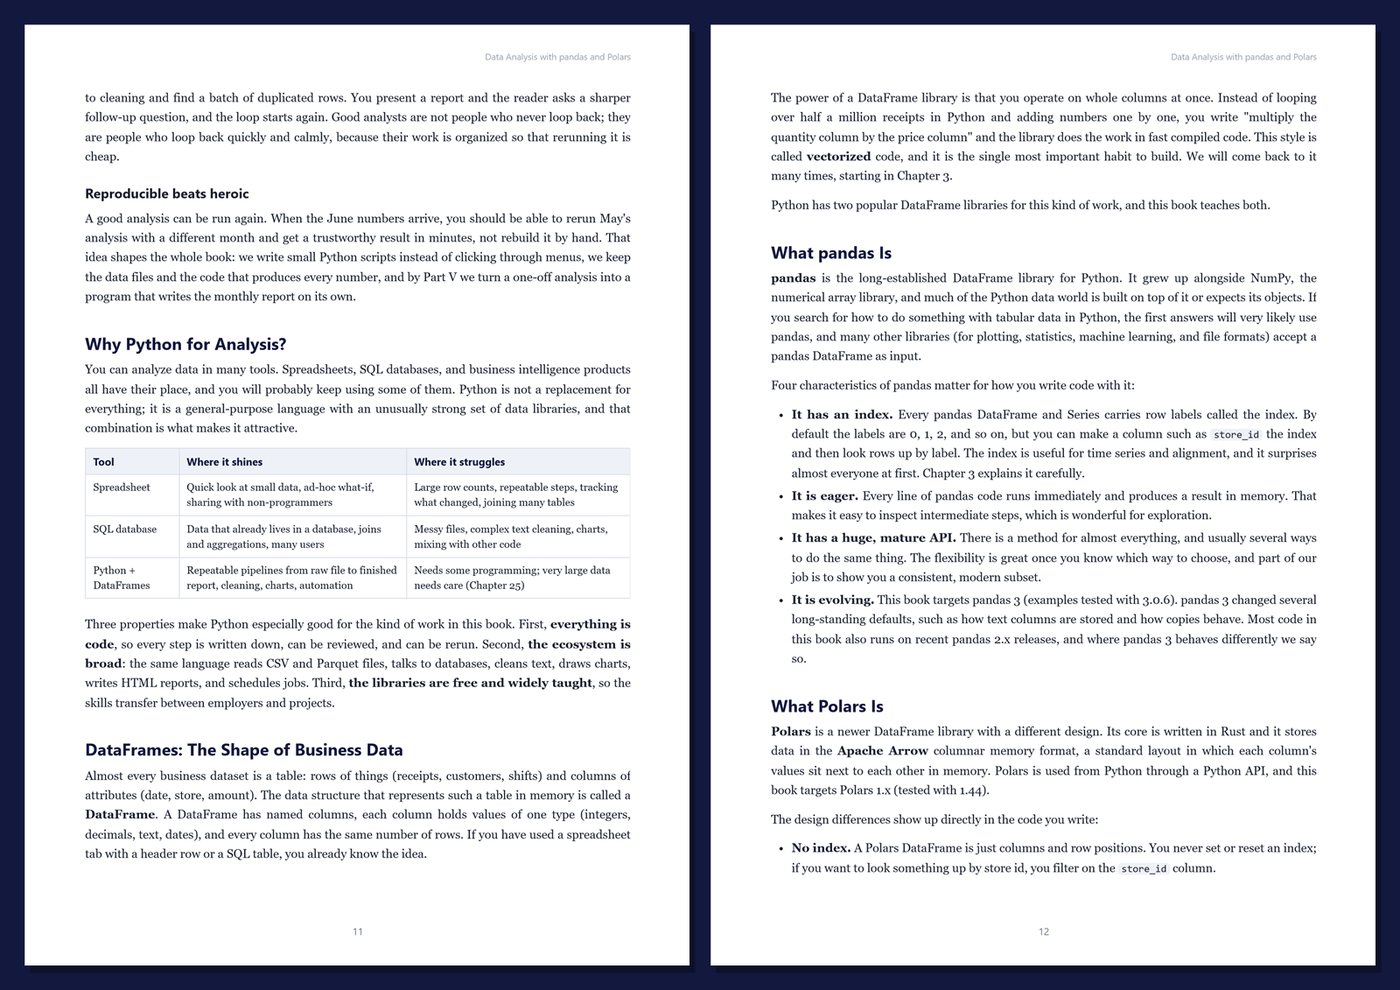
Most business questions become data questions: Which stores are growing? Did the promotion pay off? Do new loyalty members come back? Are we staffing for the morning rush? The answers live in files that are never quite ready: exports with odd headers, duplicate records, three spellings of "yes", missing clock-outs. This book teaches you to clean, combine, analyze, visualize, and report that data in Python, one runnable example at a time.
We use the two DataFrame libraries you are most likely to meet today. pandas is the long-established standard; Polars is a newer library built on Apache Arrow, with expressions, lazy queries, and multithreaded execution. Instead of picking a side, every core task is shown in pandas and then in Polars, with the differences explained, so you can read and write both and choose the right tool for each job. You need basic Python; no prior pandas, Polars, or statistics experience is required.
What's inside
- How pandas and Polars think: Series, DataFrames, indexes, data types, expressions, contexts, and lazy queries
- Reading and writing CSV, Parquet, JSON, Excel, and SQLite — and why Parquet beats CSV for analysis
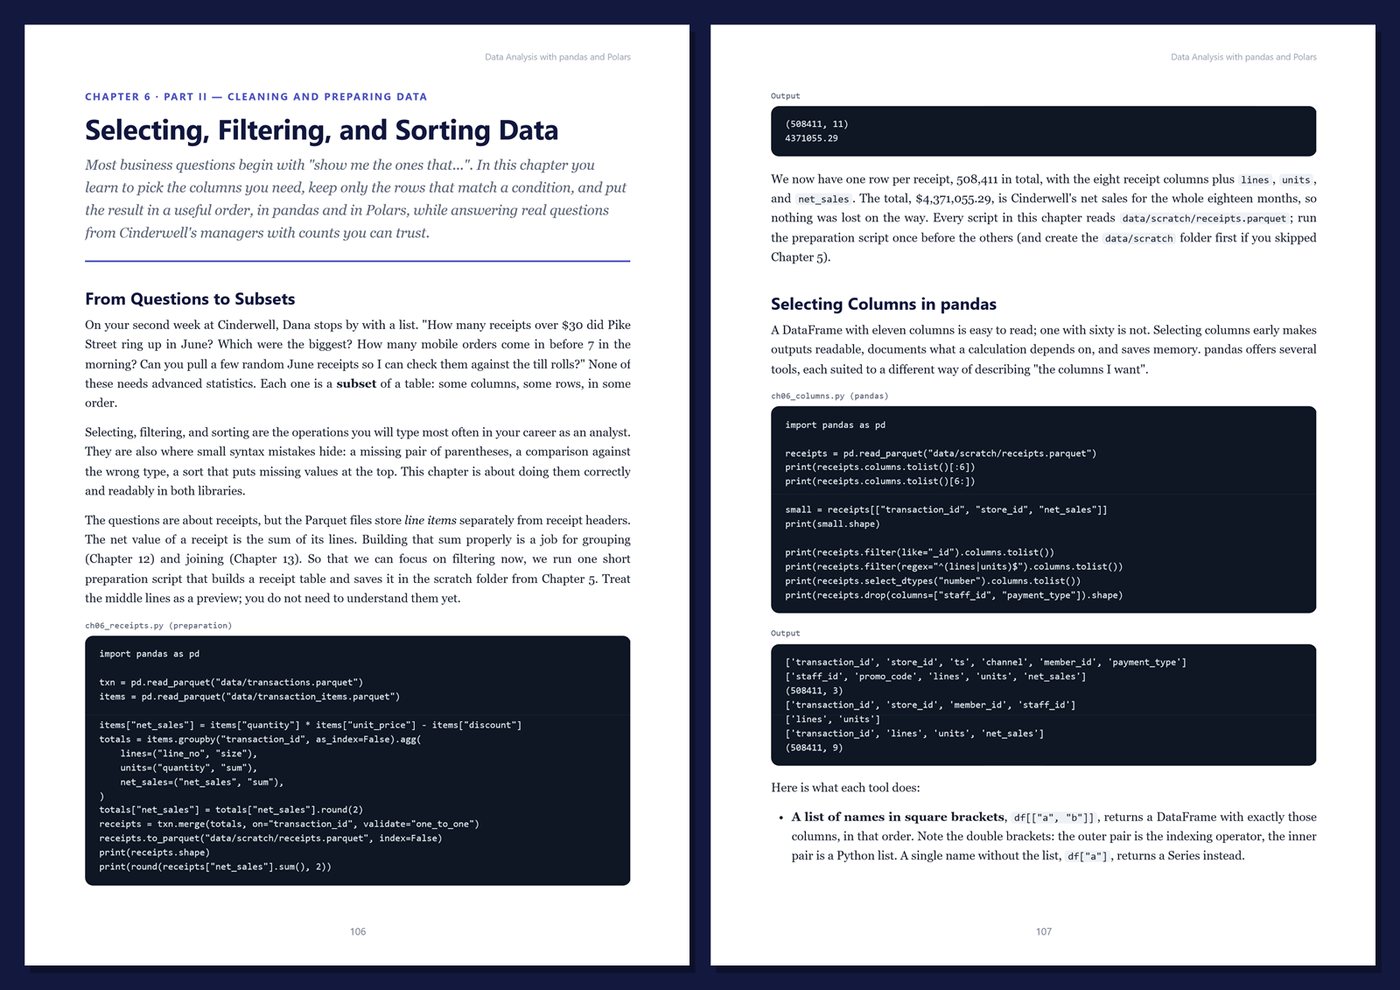
- Cleaning real messes: column names, types, duplicates, missing-value tokens, test records, text, categories, and mixed date formats
- Dates, times, and time zones, including daylight saving time traps
- Data validation with explicit rules, quality reports, and reconciliation to the cent
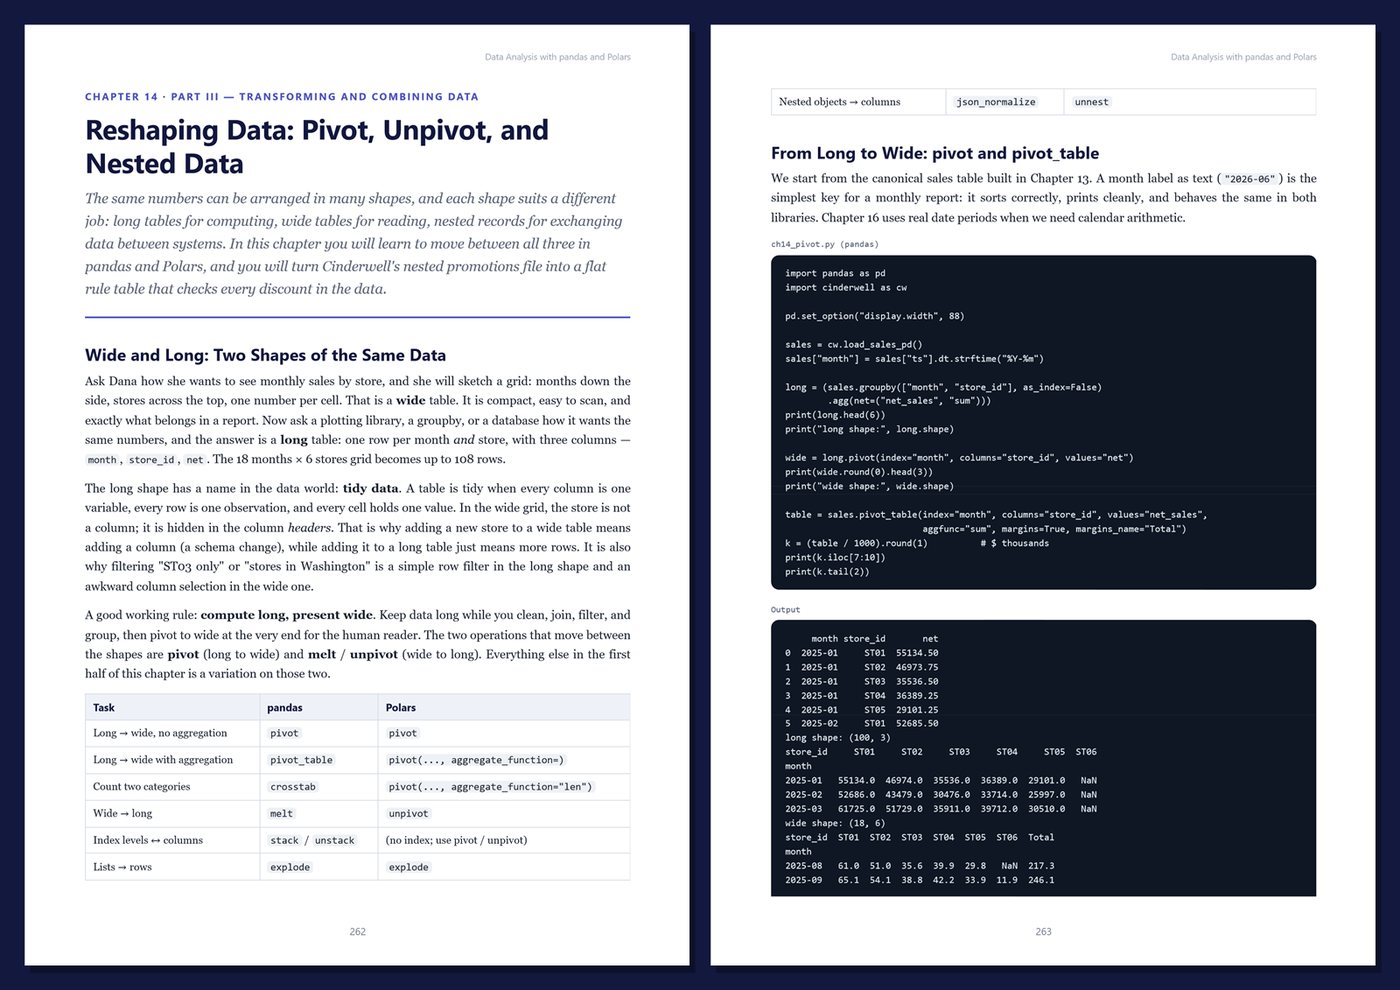
- New columns, conditions, grouping and aggregation, joins that neither lose nor duplicate rows, pivot and unpivot, nested JSON, and window functions
- Business analysis: time series and seasonality, descriptive statistics, cohort retention, RFM segmentation, product mix and ABC analysis, basket analysis, price changes, promotions, and labor productivity
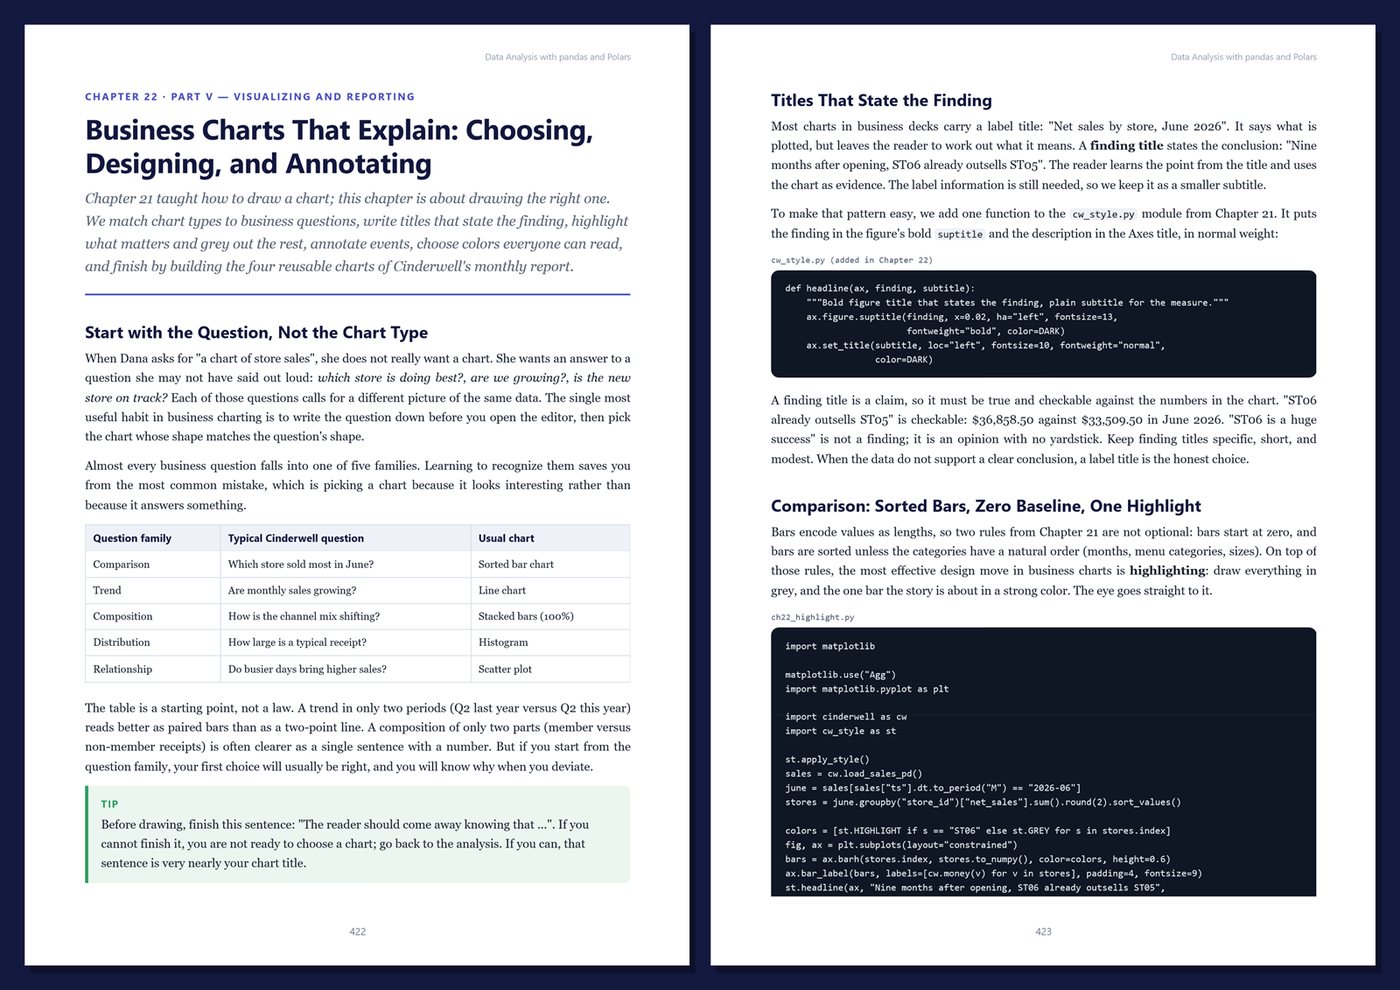
- matplotlib from the ground up and chart design that states a finding
- Report-ready tables with pandas Styler and HTML, and an automated monthly sales report built with one command
- Performance and scale: memory-aware types, lazy evaluation, streaming, and when to reach for DuckDB SQL
- Reliable analysis code with functions, unit tests, pinned versions, and reproducible outputs
- A capstone quarterly business review and an honest guide to choosing between pandas and Polars
One running example, start to finish. You are the new data analyst at Cinderwell Coffee, a fictional chain of six coffee shops — three cafes, a commuter kiosk, a drive-thru, and a new campus cafe that opens partway through the data. With eighteen months of data — over 500,000 receipts and 800,000 line items in Parquet, plus products, stores, staff, shifts, nested JSON promotions, a messy loyalty member list, and a messy point-of-sale export — you answer the questions of the operations director, the loyalty manager, and the finance manager. A seeded script generates all the data, so every number in the book is the number you get on your own machine.
Current and honest. Every example was run with Python 3.12, pandas 3.0, Polars 1.44, NumPy 2.5, matplotlib 3.11, and DuckDB 1.5, and every output in the book is real. pandas 3 changes such as Copy-on-Write and the new default string type are covered, as are recent Polars API renames. There are no invented benchmarks or "X times faster" claims; timings appear only where measured and labeled. Every chapter includes runnable code, real output, Tips, Notes, Warnings, exercises, and Key Takeaways, and the appendices give you a side-by-side cheat sheet, templates and reference results, a production checklist, and a glossary.
Format: PDF, 572 pages (A4), linked table of contents and bookmarks. English. First Edition, 2026. Published by thenexbooks. This book is independent and is not affiliated with, sponsored by, or endorsed by the Python Software Foundation, the pandas project, Polars, NumFOCUS, the DuckDB project, or the Apache Software Foundation.
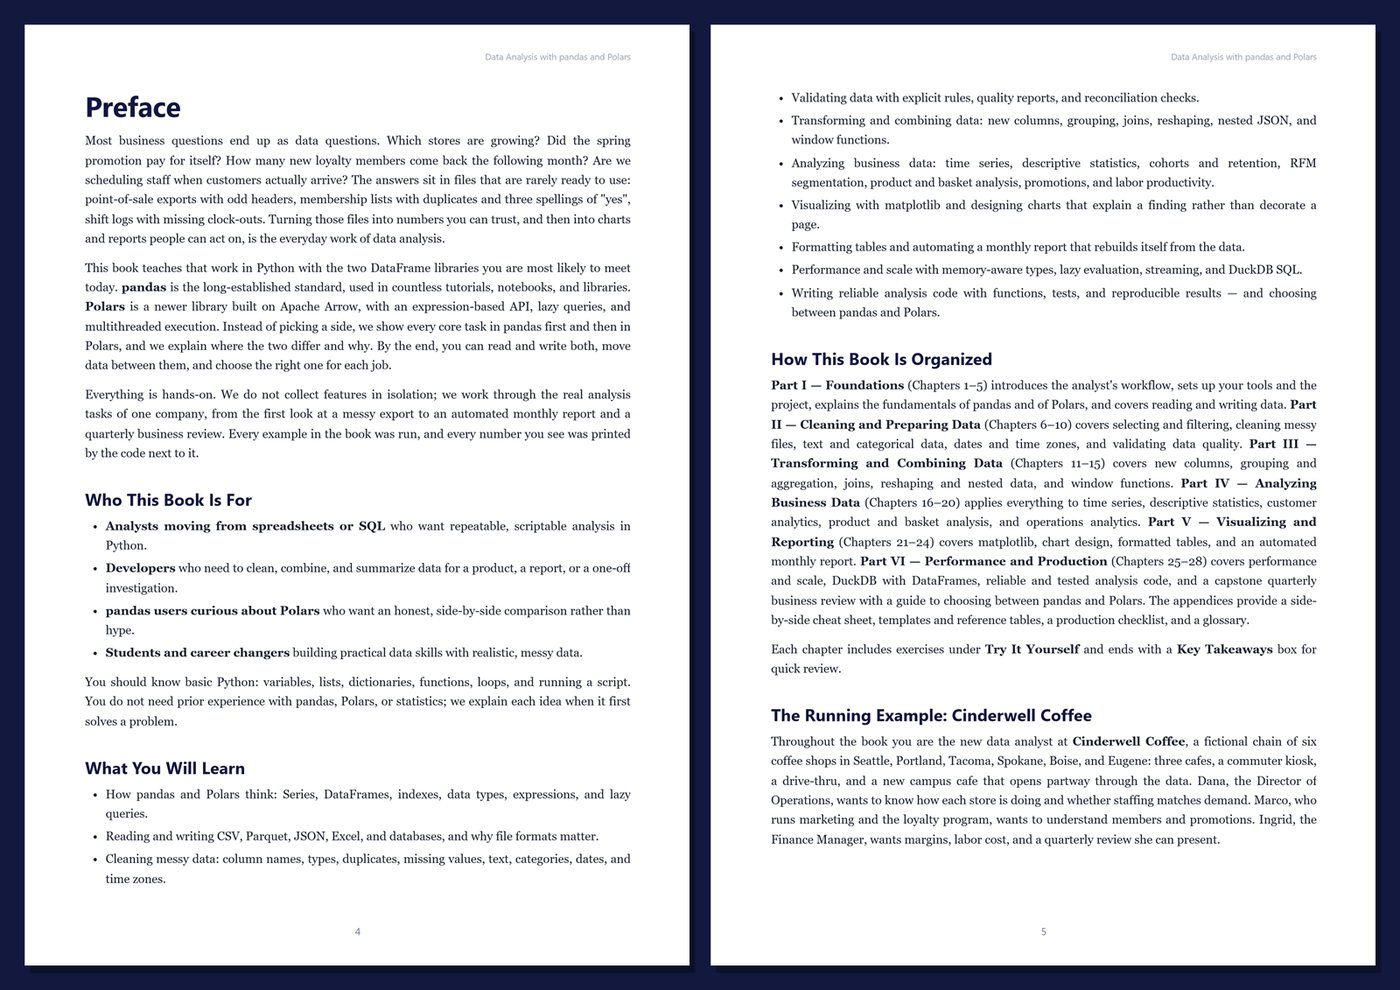
Table of Contents
Part I — Foundations
- Ch 1 · Data Analysis in Python: pandas, Polars, and the Analyst's Workflow
- Ch 2 · Setting Up Your Workspace: Python, Packages, and the Cinderwell Project
- Ch 3 · pandas Fundamentals: Series, DataFrames, Indexes, and Data Types
- Ch 4 · Polars Fundamentals: DataFrames, Expressions, and Lazy Queries
- Ch 5 · Reading and Writing Data: CSV, Parquet, JSON, Excel, and Databases
Part II — Cleaning and Preparing Data
- Ch 6 · Selecting, Filtering, and Sorting Data
- Ch 7 · Cleaning Messy Data: Columns, Types, Duplicates, and Missing Values
- Ch 8 · Text and Categorical Data: Strings, Categories, and Mappings
- Ch 9 · Dates, Times, and Time Zones
- Ch 10 · Validating Data Quality: Rules, Checks, and Reconciliation
Part III — Transforming and Combining Data
- Ch 11 · Creating New Columns: Expressions, Conditions, and Custom Functions
- Ch 12 · Grouping and Aggregation: Split, Apply, Combine
- Ch 13 · Joining and Combining Tables
- Ch 14 · Reshaping Data: Pivot, Unpivot, and Nested Data
- Ch 15 · Window Functions: Rankings, Running Totals, and Period-over-Period Change
Part IV — Analyzing Business Data
- Ch 16 · Time Series Analysis: Resampling, Rolling Windows, and Seasonality
- Ch 17 · Descriptive Statistics: Distributions, Outliers, and Fair Comparisons
- Ch 18 · Customer Analytics: Cohorts, Retention, and RFM Segmentation
- Ch 19 · Product and Basket Analysis: Mix, ABC, Pricing, and Promotions
- Ch 20 · Operations Analytics: Staffing, Labor Cost, and Store Performance
Part V — Visualizing and Reporting
- Ch 21 · Visualization Fundamentals with matplotlib
- Ch 22 · Business Charts That Explain: Choosing, Designing, and Annotating
- Ch 23 · Tables and Formatted Output: Styling, HTML, and Report-Ready Numbers
- Ch 24 · Automated Reporting: Building the Monthly Sales Report
Part VI — Performance and Production
- Ch 25 · Performance and Scale: Memory, Lazy Evaluation, and Streaming
- Ch 26 · SQL Meets DataFrames: DuckDB with pandas and Polars
- Ch 27 · Reliable Analysis Code: Functions, Tests, and Reproducibility
- Ch 28 · Capstone: The Quarterly Business Review — and Choosing Between pandas and Polars
Appendices
A · pandas and Polars Cheat Sheet
B · Templates and Reference
C · Analysis Production Checklist
D · Glossary
Book details
| Detail | |
|---|---|
| Pages | 572 |
| Format | PDF (A4) |
| Language | English |
| Level | Beginner to Intermediate |
| Edition | 1st Edition (2026) |
| Download on this site | Free sample, first 20 pages (PDF) |
| Publisher | thenexbooks |
Files you get
No reviews yet. Only buyers can review.
More from thenexbooks