 1 / 11
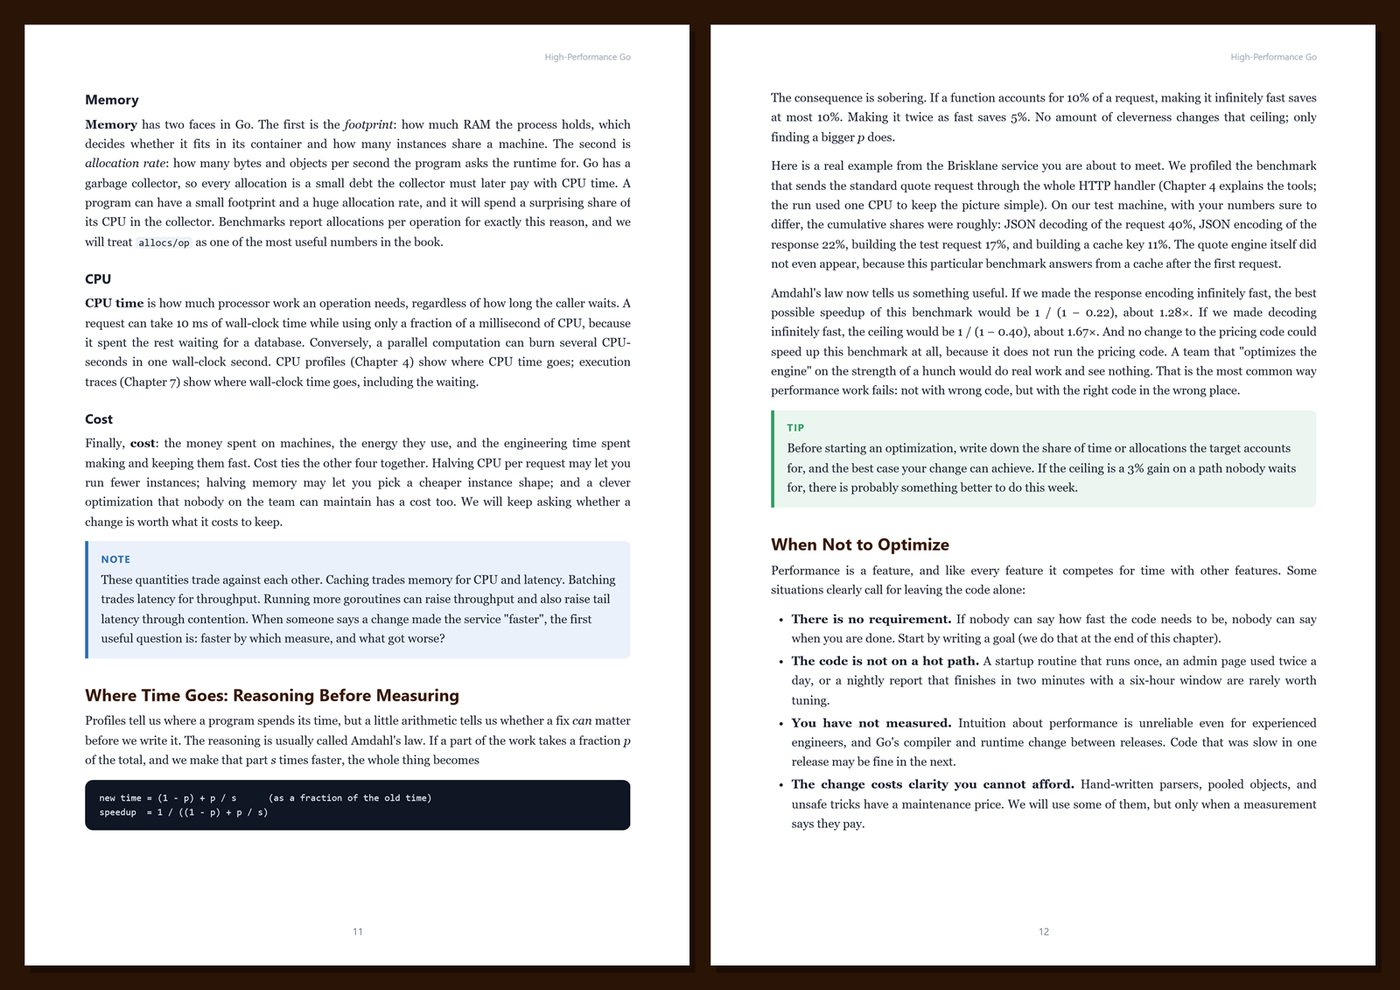
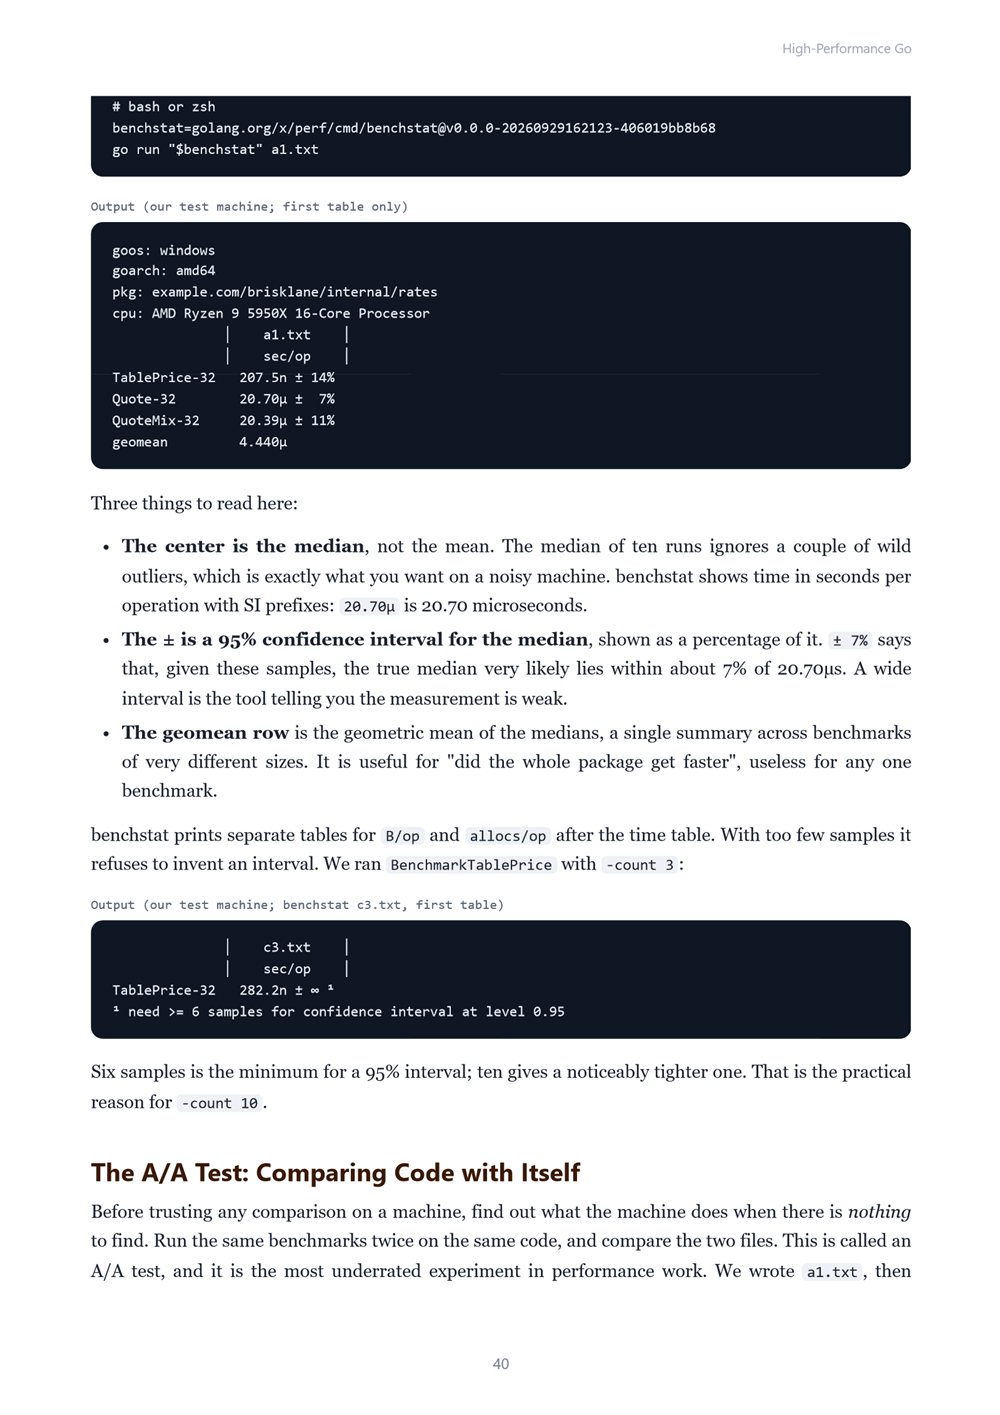
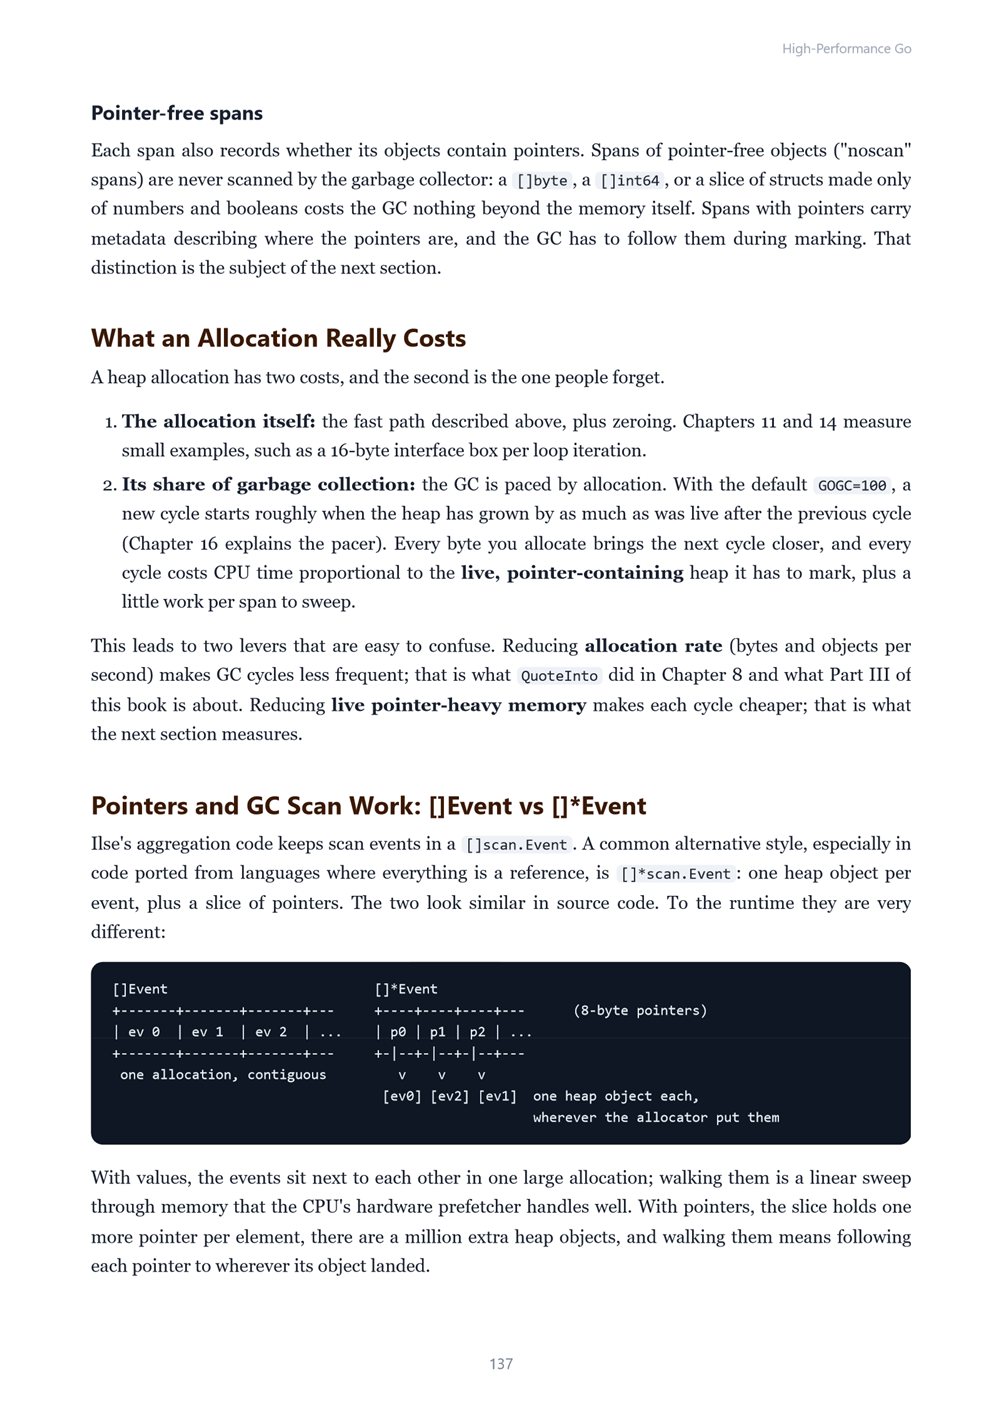
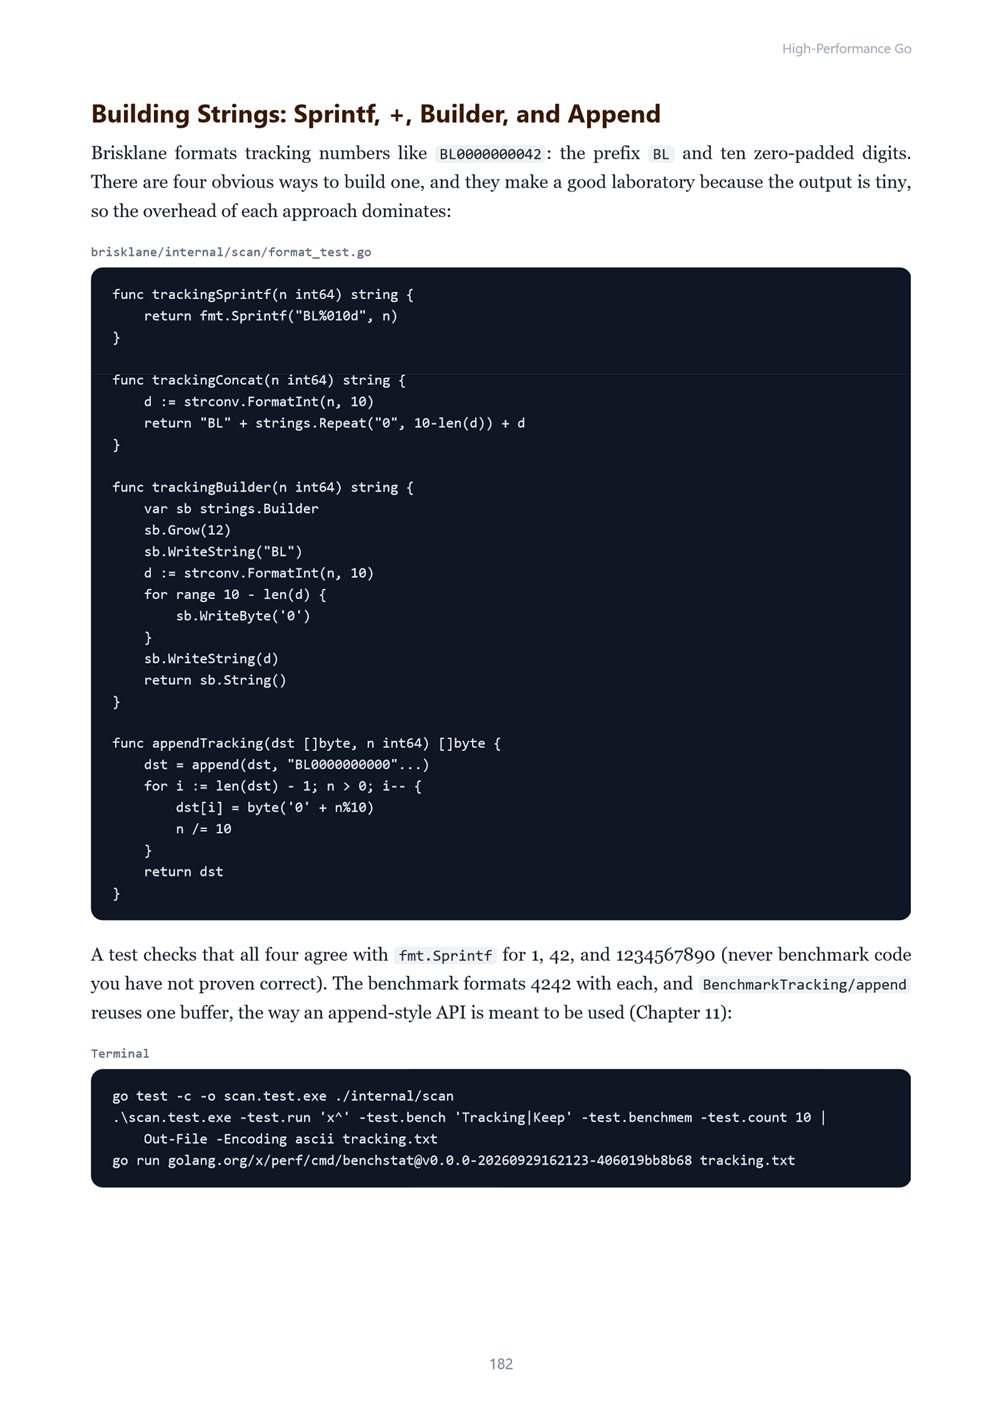
Make Go code faster and leaner with evidence instead of folklore: benchmarks with testing.B and b.Loop, benchstat, pprof CPU, heap, block, mutex, and goroutine profiles, execution traces, escape analysis, allocation reduction, the garbage collector, GOGC and GOMEMLIMIT, PGO, concurrency, I/O…
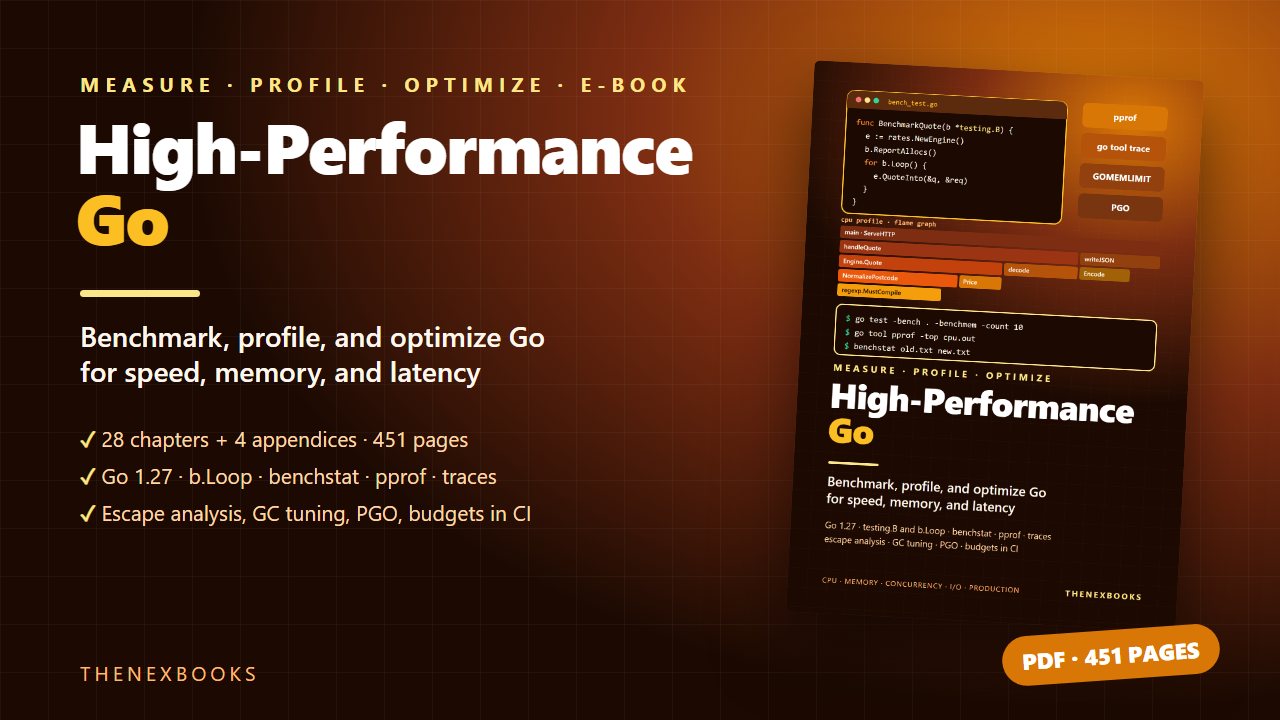
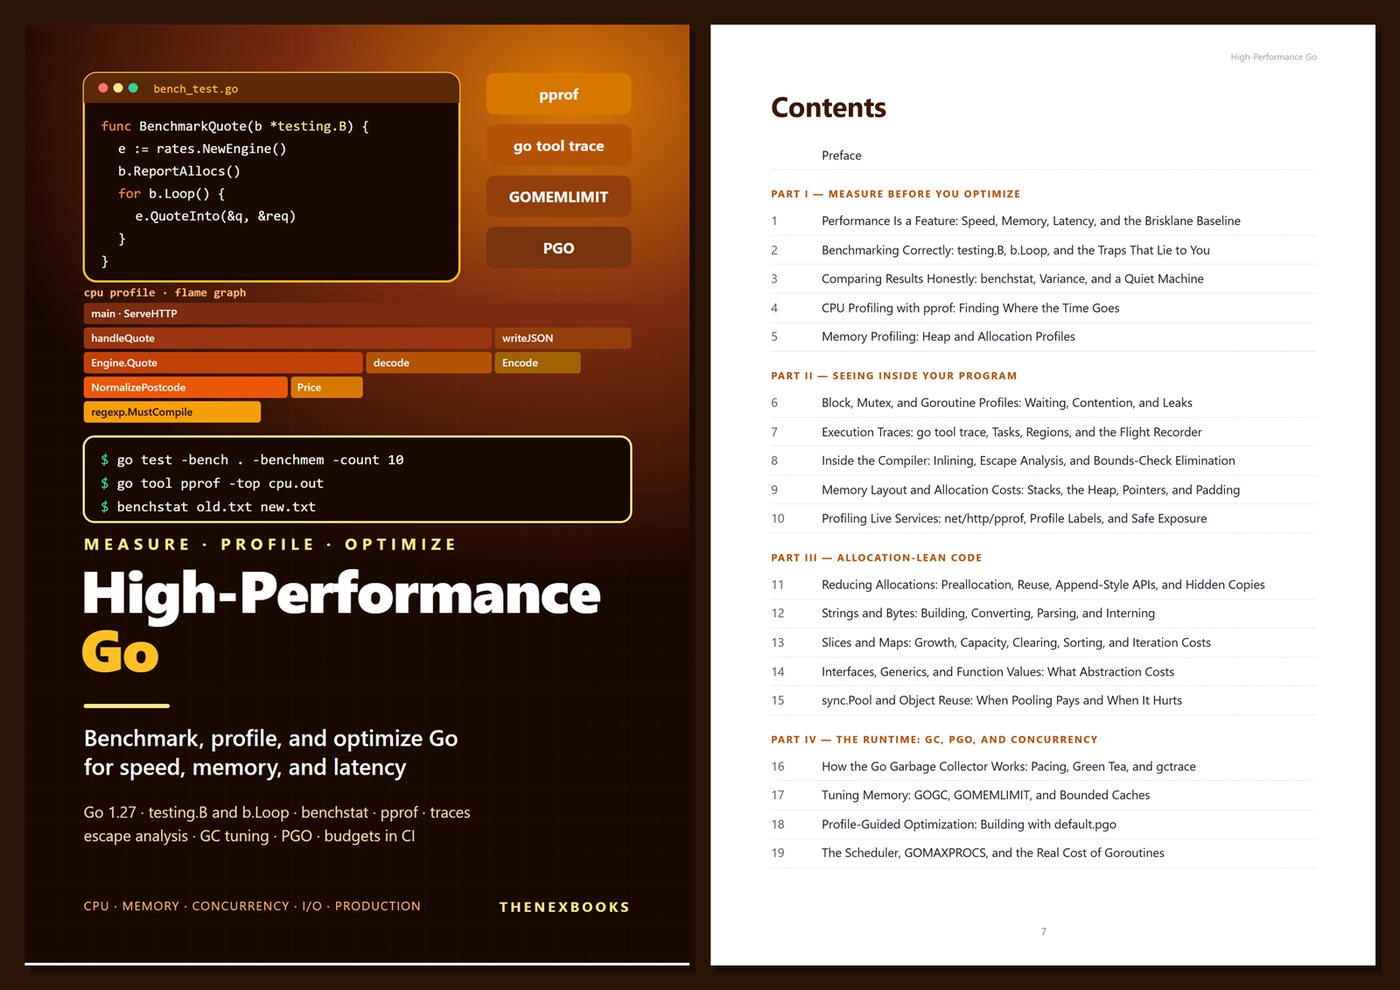
Benchmark, Profile, and Optimize Go for Speed, Memory, and Latency
Read before you buy: the PDF here is a free sample — the first 20 pages of the 451-page book (payments, sales and reviews on this demo site are sample data). Get the full e-book at thenexbooks on Gumroad.
Find out where your Go program really spends its time and memory, fix it, and prove the fix.
Go is fast, but your program is only as fast as the code you write in it. A Go service can still compile the same regular expression on every request, allocate a fresh buffer for every response, serialize every request behind one mutex, open a new connection for every outbound call, or let a cache grow until the garbage collector spends its life scanning it. None of that is visible in code review. All of it shows up in latency, memory, and cost.
This book teaches a repeatable method: measure, find, fix, verify. You learn to write benchmarks that do not lie, compare results honestly with benchstat, read every kind of profile Go offers, understand what the compiler and the runtime do with your code, and keep the gains with budgets that fail the build before users notice a regression.
What's inside
- Benchmarking correctly: testing.B, b.Loop, sub-benchmarks, RunParallel, realistic inputs, and the traps that make benchmarks lie
- Honest comparisons with benchstat: variance, confidence intervals, significance, and noisy machines
- CPU and memory profiling with go tool pprof: top, list, peek, alloc_space vs inuse_space, diffs, and labels
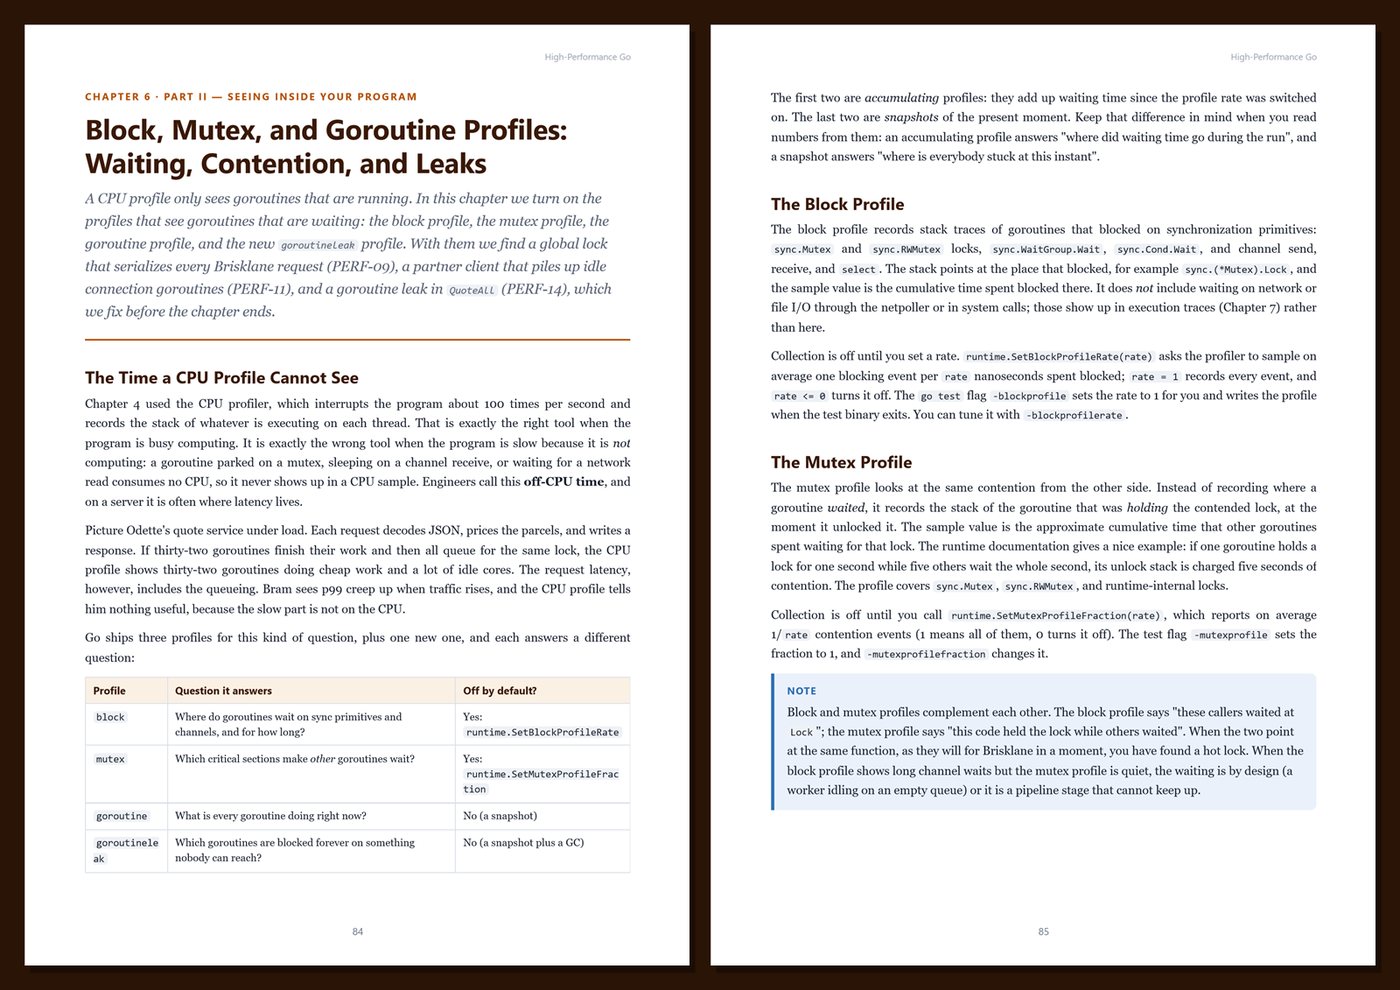
- Block, mutex, goroutine, and goroutine-leak profiles; execution traces, tasks, regions, and the flight recorder
- The compiler's view: inlining, escape analysis, bounds-check elimination, and devirtualization with -gcflags=-m
- Memory layout, struct padding, pointers and GC scanning, and the real cost of an allocation
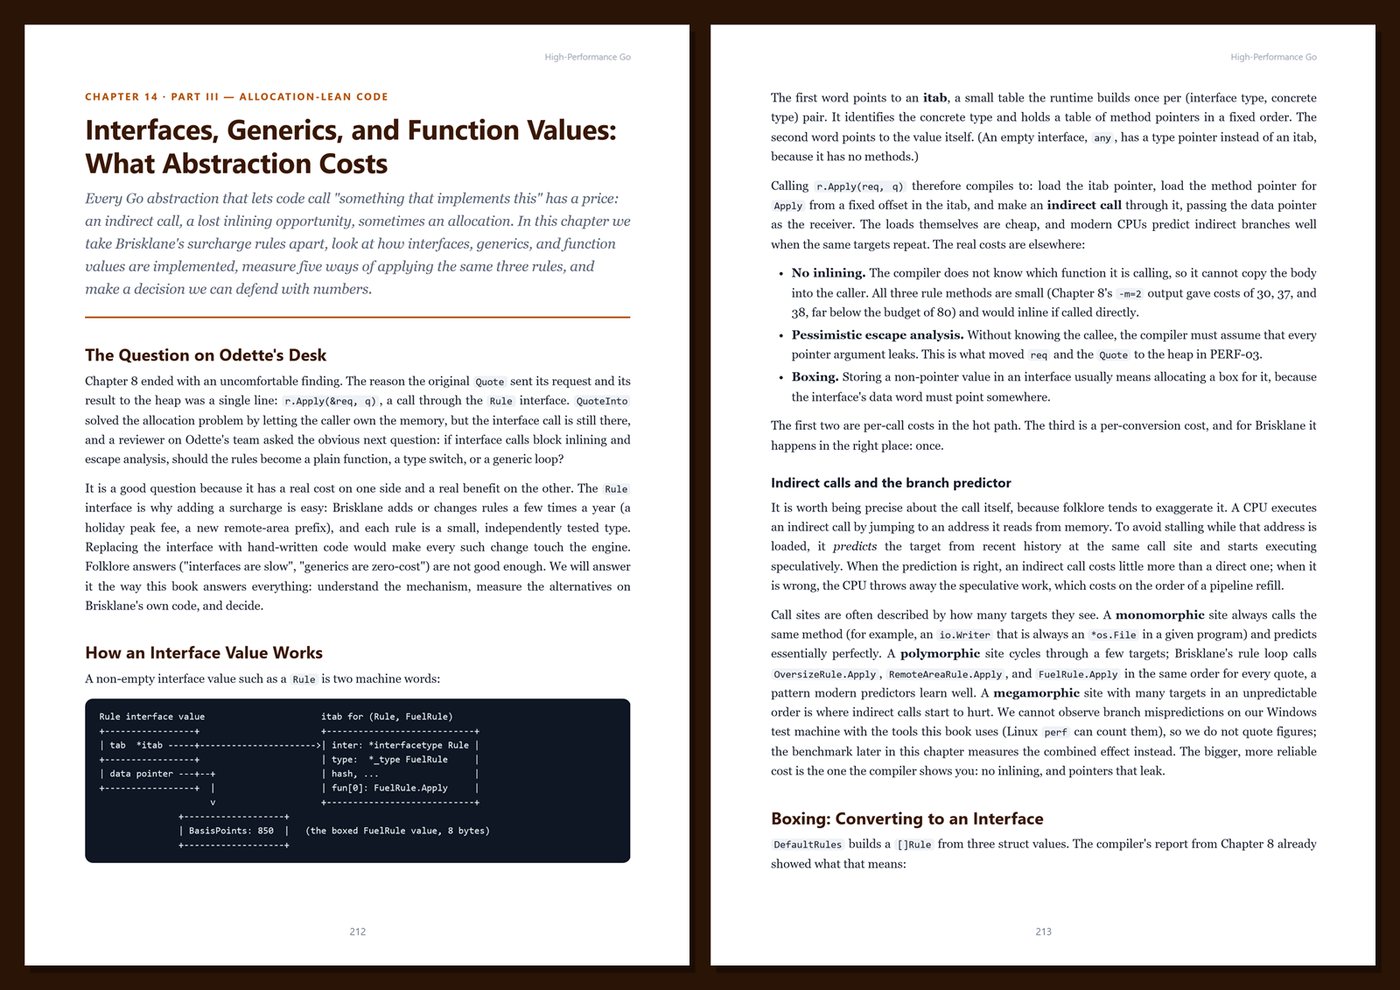
- Allocation-lean code: preallocation, reuse, append-style APIs, strings and bytes, slices and maps, interfaces and generics, sync.Pool
- The garbage collector explained, gctrace and runtime/metrics, and tuning with GOGC and GOMEMLIMIT
- Profile-guided optimization with default.pgo
- The scheduler and GOMAXPROCS, goroutine costs, contention, atomics, sharding, and false sharing
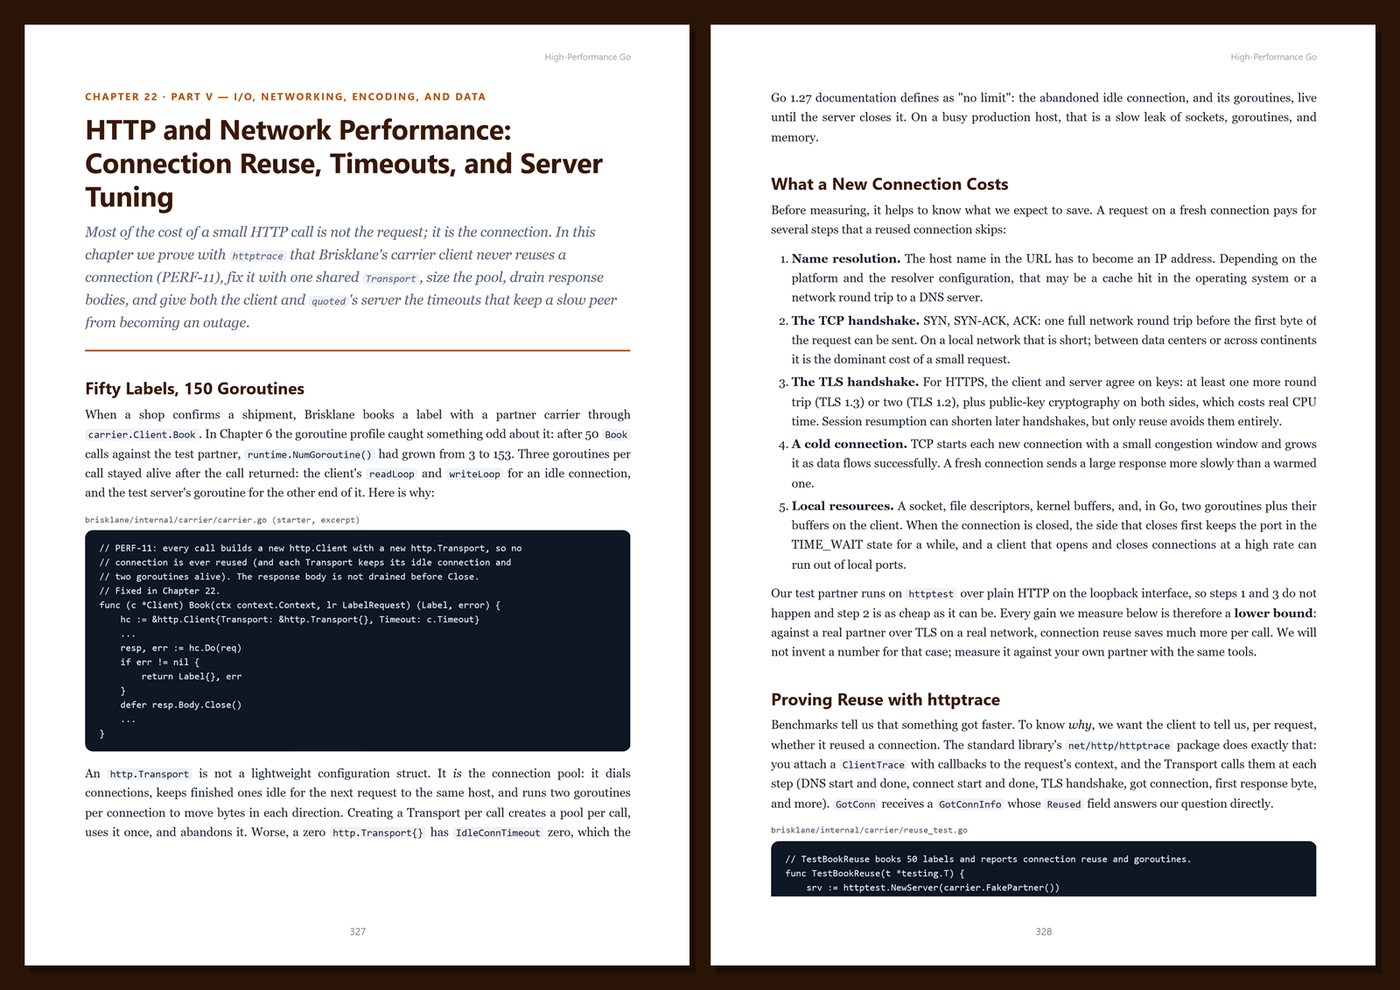
- Fast I/O with bufio, HTTP connection reuse and timeouts, JSON costs and encoding/json/v2, and database access without N+1 queries
- Load testing, percentiles, tail latency, and coordinated omission
- Profiling live services safely, continuous profiling, runtime metrics, and performance budgets in CI
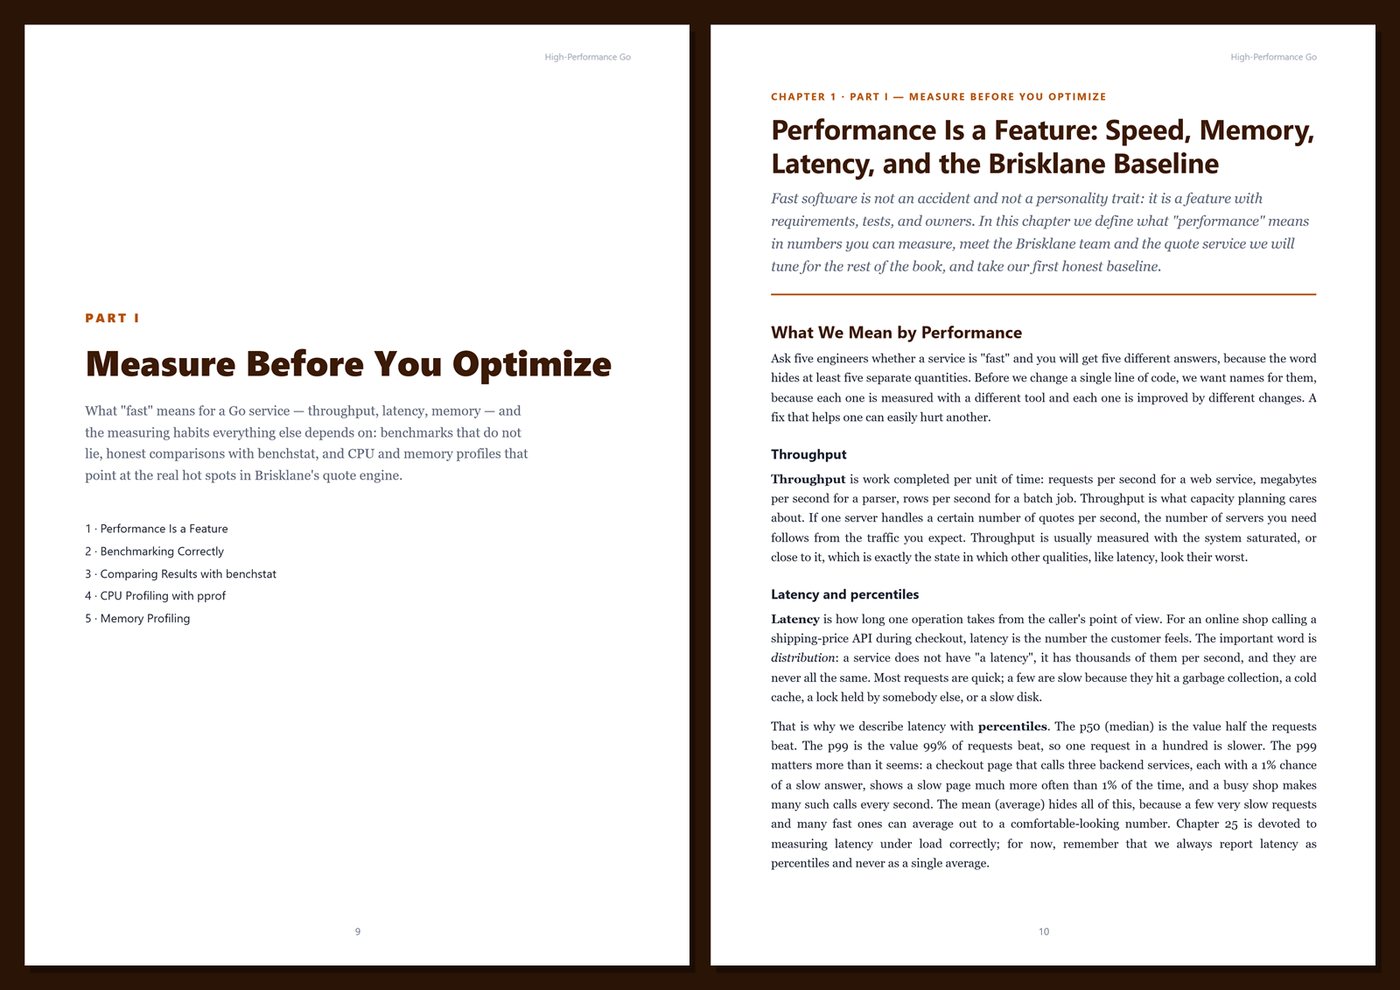
One running example, start to finish. You tune the quote service of Brisklane, a fictional parcel-shipping company whose API prices shipments at checkout for online shops. Its reference project starts slow but correct, with fourteen planted performance problems (PERF-01 to PERF-14) of the kind found in real Go code: a regexp compiled per call, formatted map keys, escaping values, a byte-at-a-time file reader, a global mutex, a leaking fan-out, an unbounded cache, a new HTTP transport per call, JSON decoded into maps, and N+1 database queries. Each chapter finds one with the right tool, explains the mechanism, fixes it, and proves the result.
Real measurements, honestly labeled. Every benchmark result and profile in the book was produced by running the code shown on our test machine, and is labeled that way; your numbers will differ, so the book teaches you to compare relative changes on your own hardware. There are no invented speedups, statistics, or "typical" numbers, and compiler claims are backed by the compiler's own output from Go 1.27. Every chapter includes runnable code, Tips, Notes, Warnings, Try It Yourself exercises, and Key Takeaways.
Format: PDF, 451 pages (A4), linked table of contents and bookmarks. English. First Edition, 2026. Published by thenexbooks. Includes the Brisklane starter project (Go module) that the book builds on. This book is independent and is not affiliated with or endorsed by Google or the Go project.
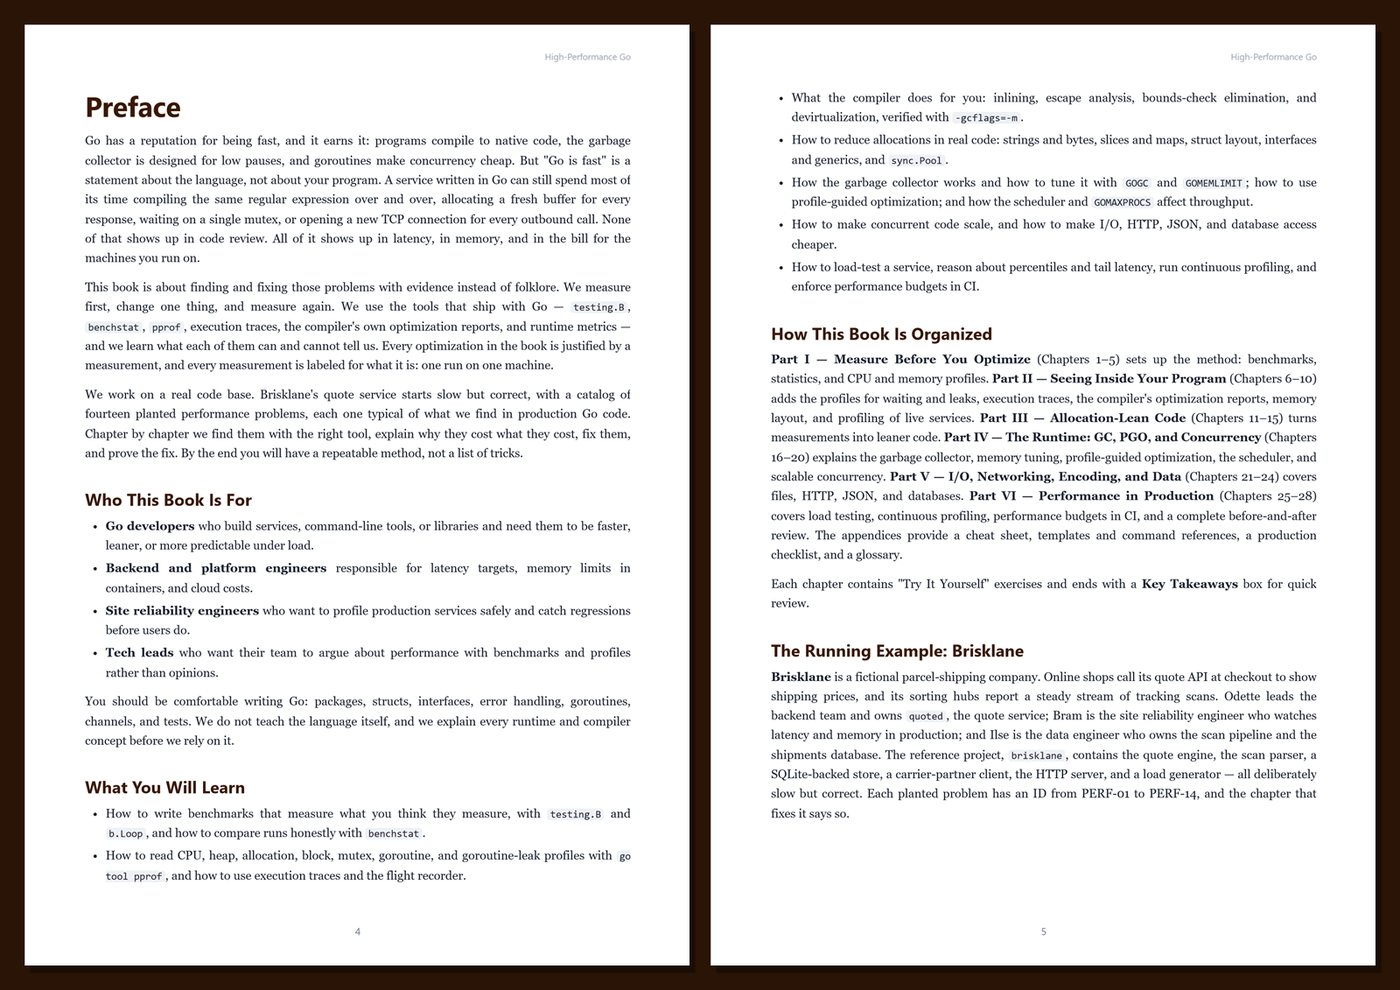
Table of Contents
Part I — Measure Before You Optimize
- Ch 1 · Performance Is a Feature: Speed, Memory, Latency, and the Brisklane Baseline
- Ch 2 · Benchmarking Correctly: testing.B, b.Loop, and the Traps That Lie to You
- Ch 3 · Comparing Results Honestly: benchstat, Variance, and a Quiet Machine
- Ch 4 · CPU Profiling with pprof: Finding Where the Time Goes
- Ch 5 · Memory Profiling: Heap and Allocation Profiles
Part II — Seeing Inside Your Program
- Ch 6 · Block, Mutex, and Goroutine Profiles: Waiting, Contention, and Leaks
- Ch 7 · Execution Traces: go tool trace, Tasks, Regions, and the Flight Recorder
- Ch 8 · Inside the Compiler: Inlining, Escape Analysis, and Bounds-Check Elimination
- Ch 9 · Memory Layout and Allocation Costs: Stacks, the Heap, Pointers, and Padding
- Ch 10 · Profiling Live Services: net/http/pprof, Profile Labels, and Safe Exposure
Part III — Allocation-Lean Code
- Ch 11 · Reducing Allocations: Preallocation, Reuse, Append-Style APIs, and Hidden Copies
- Ch 12 · Strings and Bytes: Building, Converting, Parsing, and Interning
- Ch 13 · Slices and Maps: Growth, Capacity, Clearing, Sorting, and Iteration Costs
- Ch 14 · Interfaces, Generics, and Function Values: What Abstraction Costs
- Ch 15 · sync.Pool and Object Reuse: When Pooling Pays and When It Hurts
Part IV — The Runtime: GC, PGO, and Concurrency
- Ch 16 · How the Go Garbage Collector Works: Pacing, Green Tea, and gctrace
- Ch 17 · Tuning Memory: GOGC, GOMEMLIMIT, and Bounded Caches
- Ch 18 · Profile-Guided Optimization: Building with default.pgo
- Ch 19 · The Scheduler, GOMAXPROCS, and the Real Cost of Goroutines
- Ch 20 · Concurrency Performance: Contention, Atomics, Sharding, and False Sharing
Part V — I/O, Networking, Encoding, and Data
- Ch 21 · Fast I/O: Buffering, bufio, io.Copy, and System Call Costs
- Ch 22 · HTTP and Network Performance: Connection Reuse, Timeouts, and Server Tuning
- Ch 23 · JSON and Encoding Costs: encoding/json, json/v2, Streaming, and Alternatives
- Ch 24 · Database Access Performance: Pools, Prepared Statements, Batching, and N+1 Queries
Part VI — Performance in Production
- Ch 25 · Latency Under Load: Load Testing, Percentiles, and Tail Latency
- Ch 26 · Continuous Profiling and Runtime Metrics in Production
- Ch 27 · Performance Budgets in CI: Benchmark Gates, Allocation Budgets, and Regressions
- Ch 28 · Case Study: The Brisklane Tuning Review, from Baseline to Budget
Appendices
A · High-Performance Go Cheat Sheet
B · Templates and Command Reference
C · Performance Production Checklist
D · Glossary
New to Go? Start with Go Programming from Zero. Building production services? Go (Golang) for Backend Developers covers gRPC, PostgreSQL, Redis, messaging, observability, and Kubernetes.
Book details
| Detail | |
|---|---|
| Pages | 451 |
| Format | PDF (A4) + starter project (Go) |
| Language | English |
| Level | Intermediate to Advanced |
| Edition | 1st Edition (2026) |
| Download on this site | Free sample, first 20 pages (PDF) |
| Publisher | thenexbooks |
Files you get
No reviews yet. Only buyers can review.
More from thenexbooks