 1 / 11
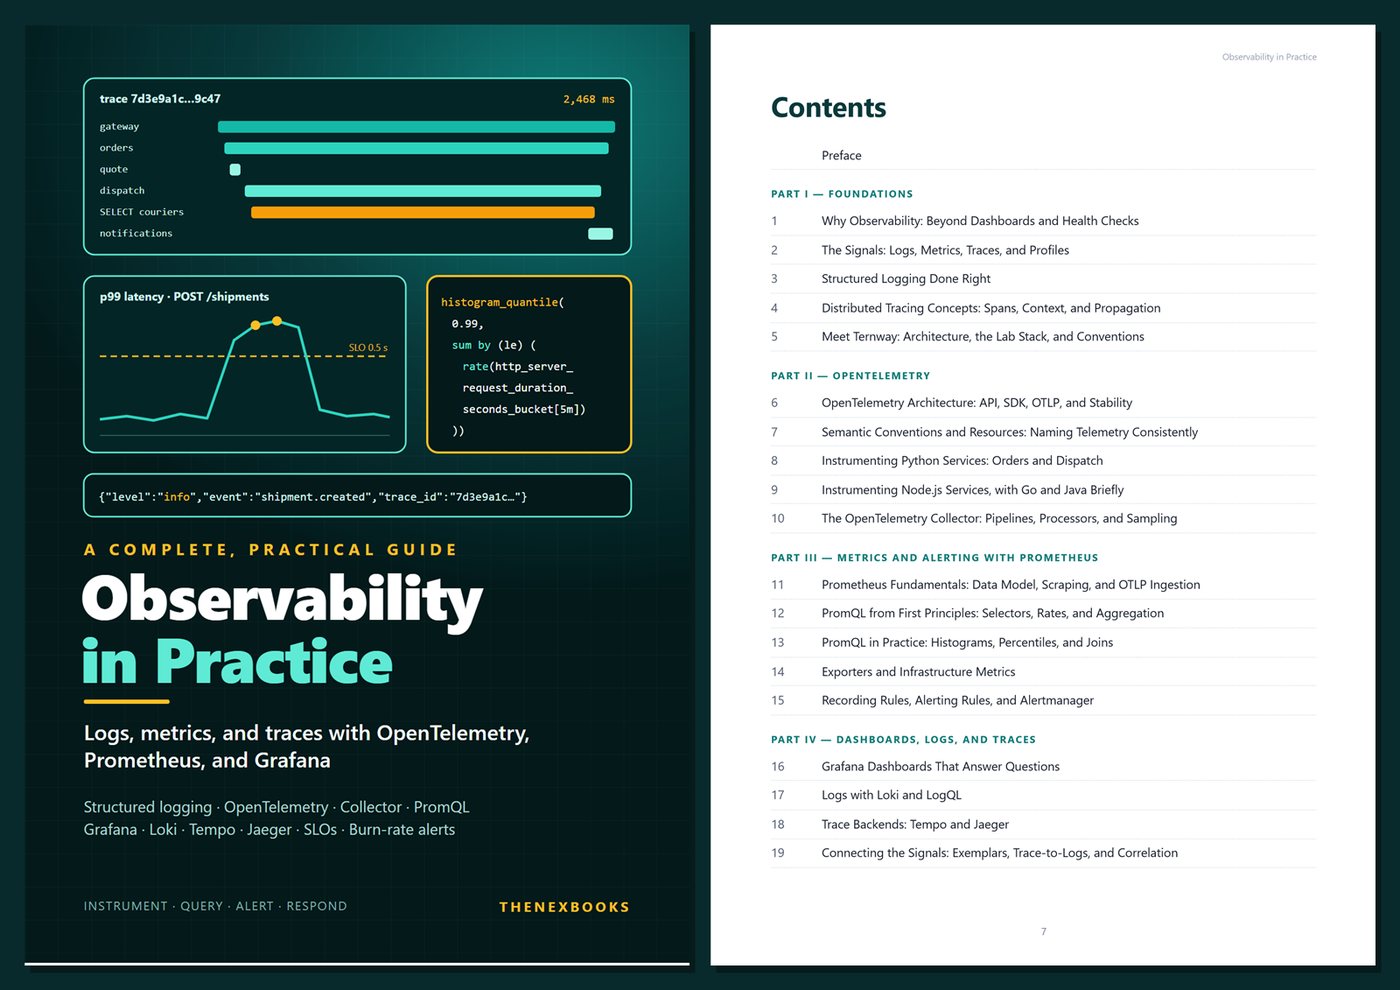
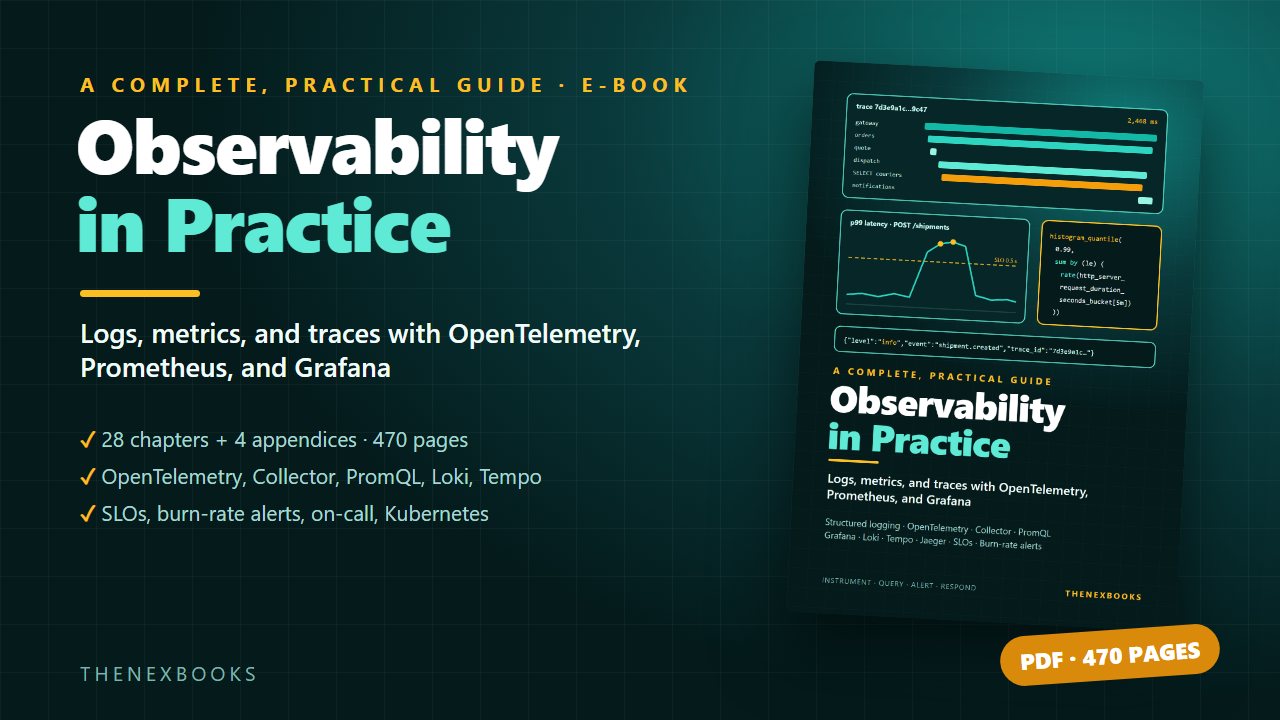
Learn observability by instrumenting a real-world microservice system end to end: structured logging, distributed tracing, OpenTelemetry (API, SDK, Collector, OTLP, semantic conventions), Python and Node.js instrumentation, Prometheus and PromQL, exporters, alerting rules and Alertmanager, Grafana…
Logs, Metrics, and Traces with OpenTelemetry, Prometheus, and Grafana
Read before you buy: the PDF here is a free sample — the first 20 pages of the 470-page book (payments, sales and reviews on this demo site are sample data). Get the full e-book at thenexbooks on Gumroad.
Stop guessing in production. Build telemetry that answers the questions you have not thought of yet.
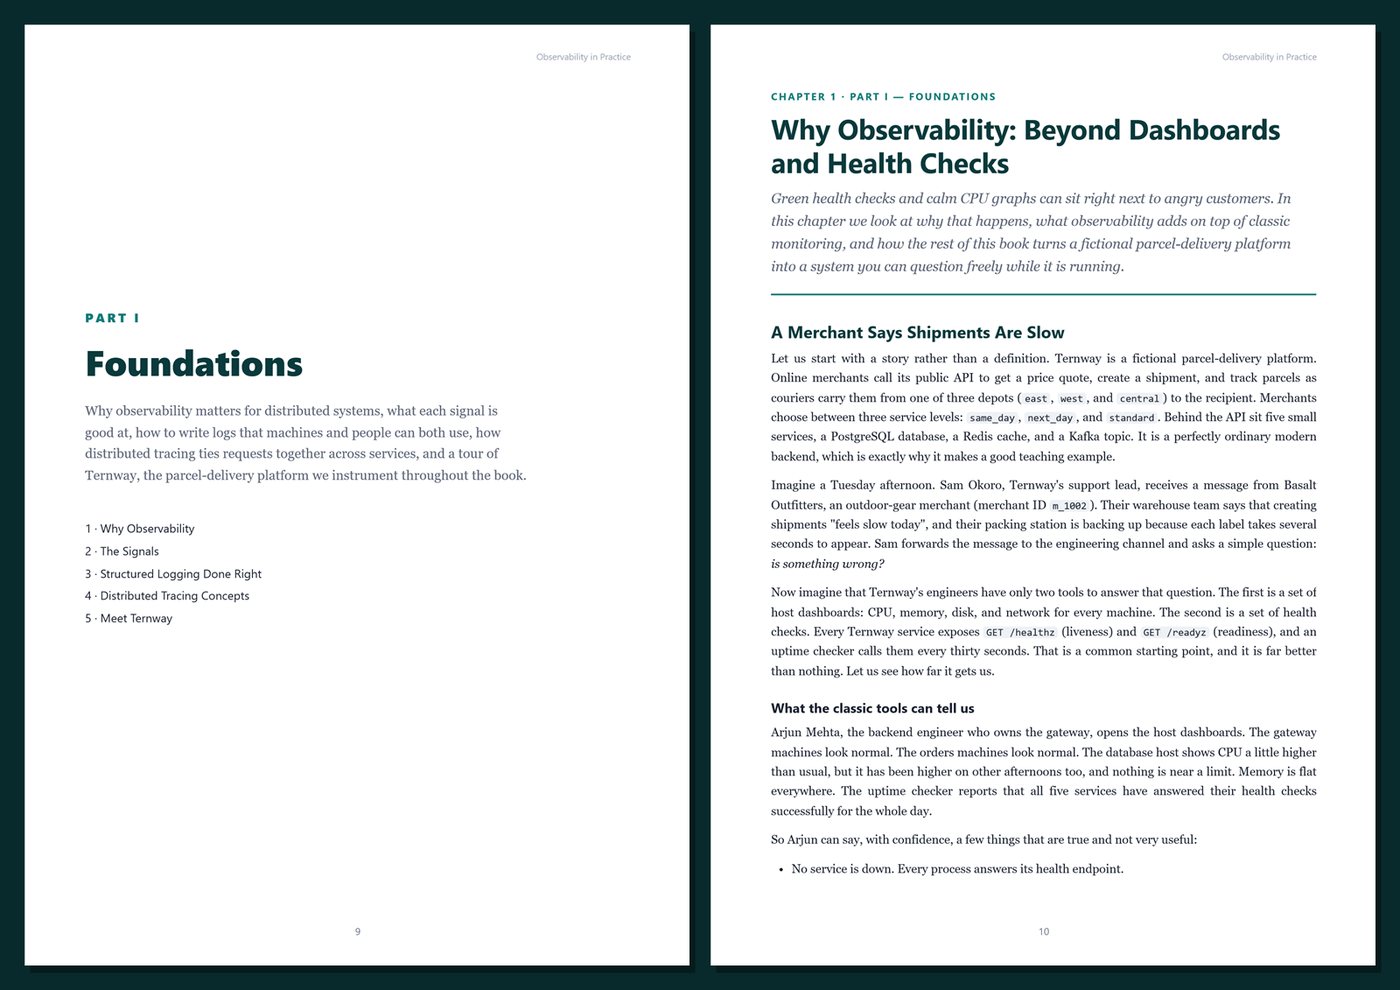
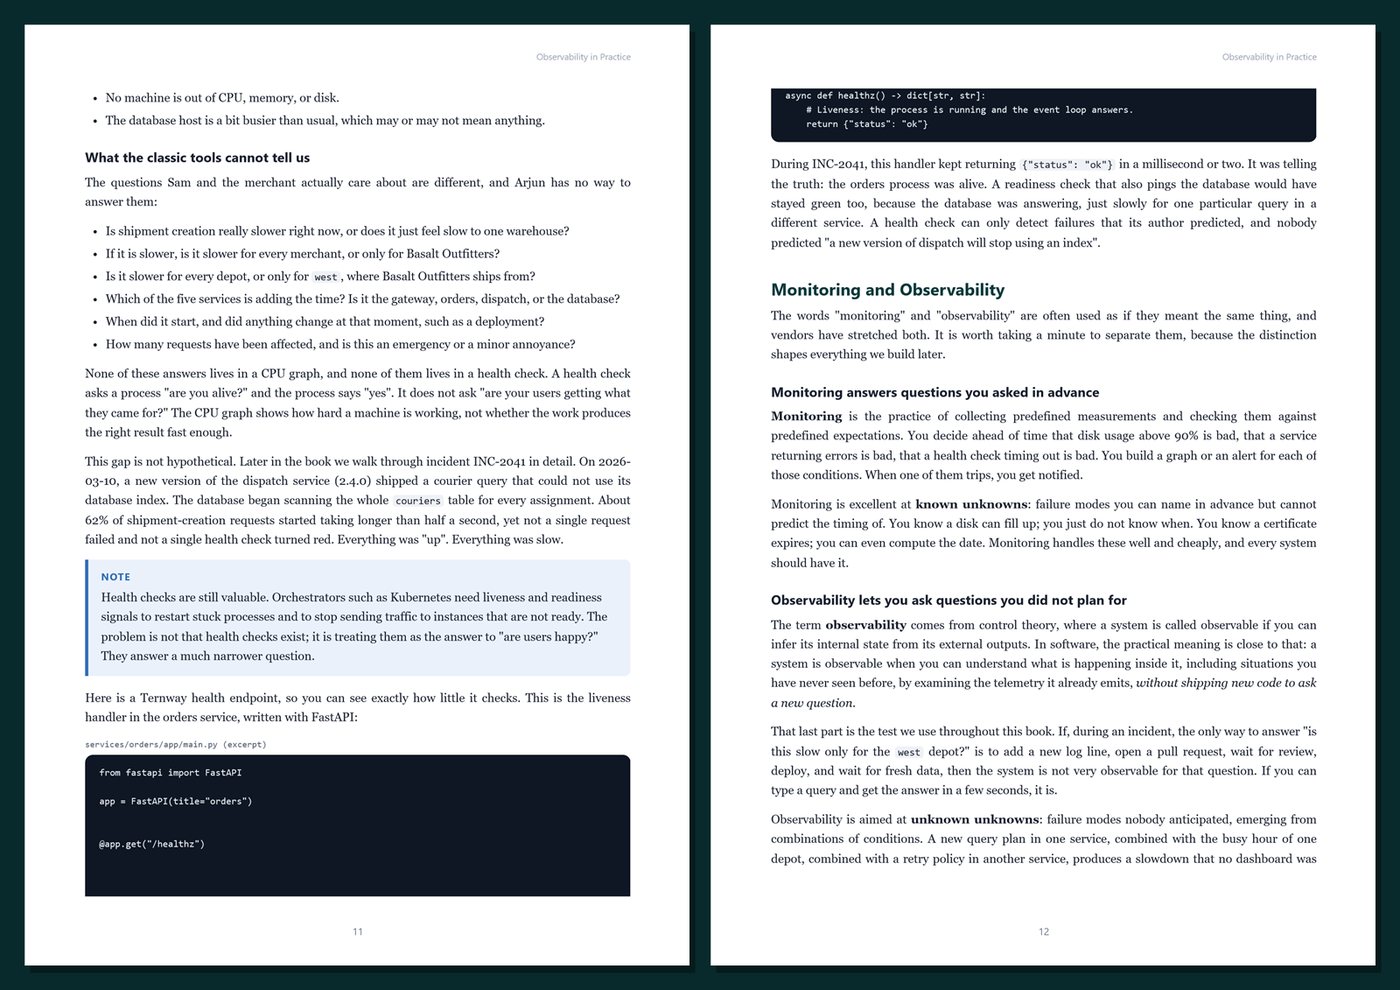
"Shipments are slow" — and every dashboard is green. Modern systems fail in ways that CPU graphs and health checks cannot explain. Observability is the practice of producing logs, metrics, and traces that let you ask new questions about a running system and get answers in minutes instead of redeploys.
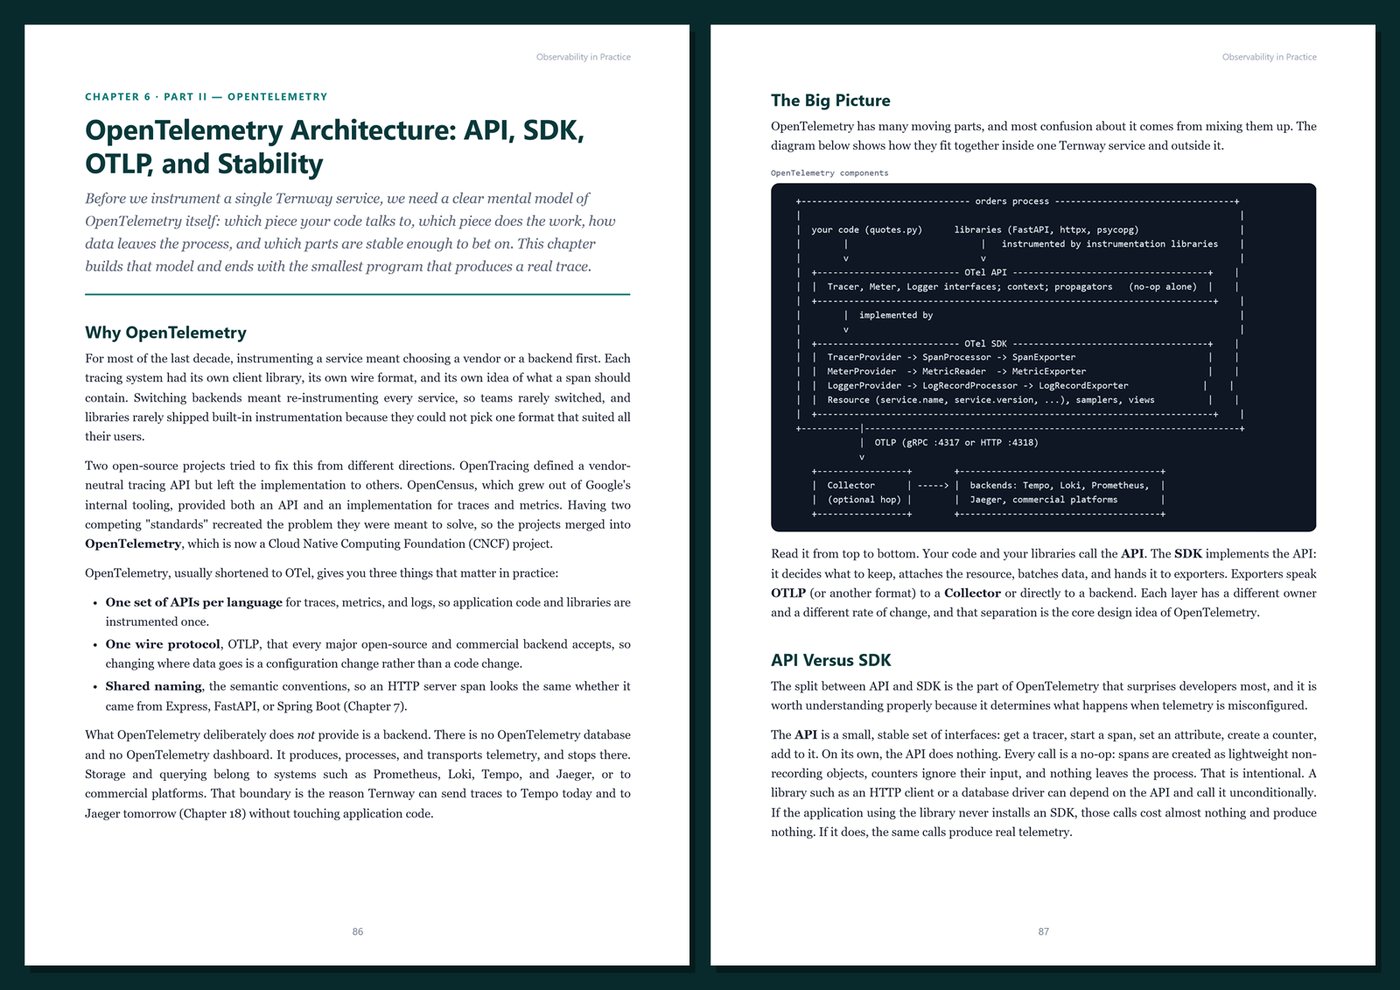
This book teaches that practice with the open, vendor-neutral tools most teams now use: OpenTelemetry to produce telemetry, Prometheus to store metrics and drive alerts, Grafana to visualize, Loki for logs, and Tempo or Jaeger for traces. You do not just install tools. You instrument a complete system, define SLOs with exact numbers, build alerts that page only when users are hurting, and follow realistic incidents minute by minute.
What's inside
- Why observability matters, what each signal (logs, metrics, traces, profiles) is good at, and the RED, USE, and golden-signals methods
- Structured logging done right: JSON lines, consistent fields, correlation with trace IDs, and keeping secrets and personal data out
- Distributed tracing concepts: spans, span kinds, W3C Trace Context, baggage, and head vs tail sampling
- OpenTelemetry in depth: API vs SDK, OTLP, resources, semantic conventions, and an honest look at the stability of each signal per language
- Hands-on instrumentation of Python (FastAPI) and Node.js (Express) services — zero-code and manual — plus how Java and Go fit in
- The OpenTelemetry Collector: pipelines, processors, tail sampling, redaction, connectors, and troubleshooting
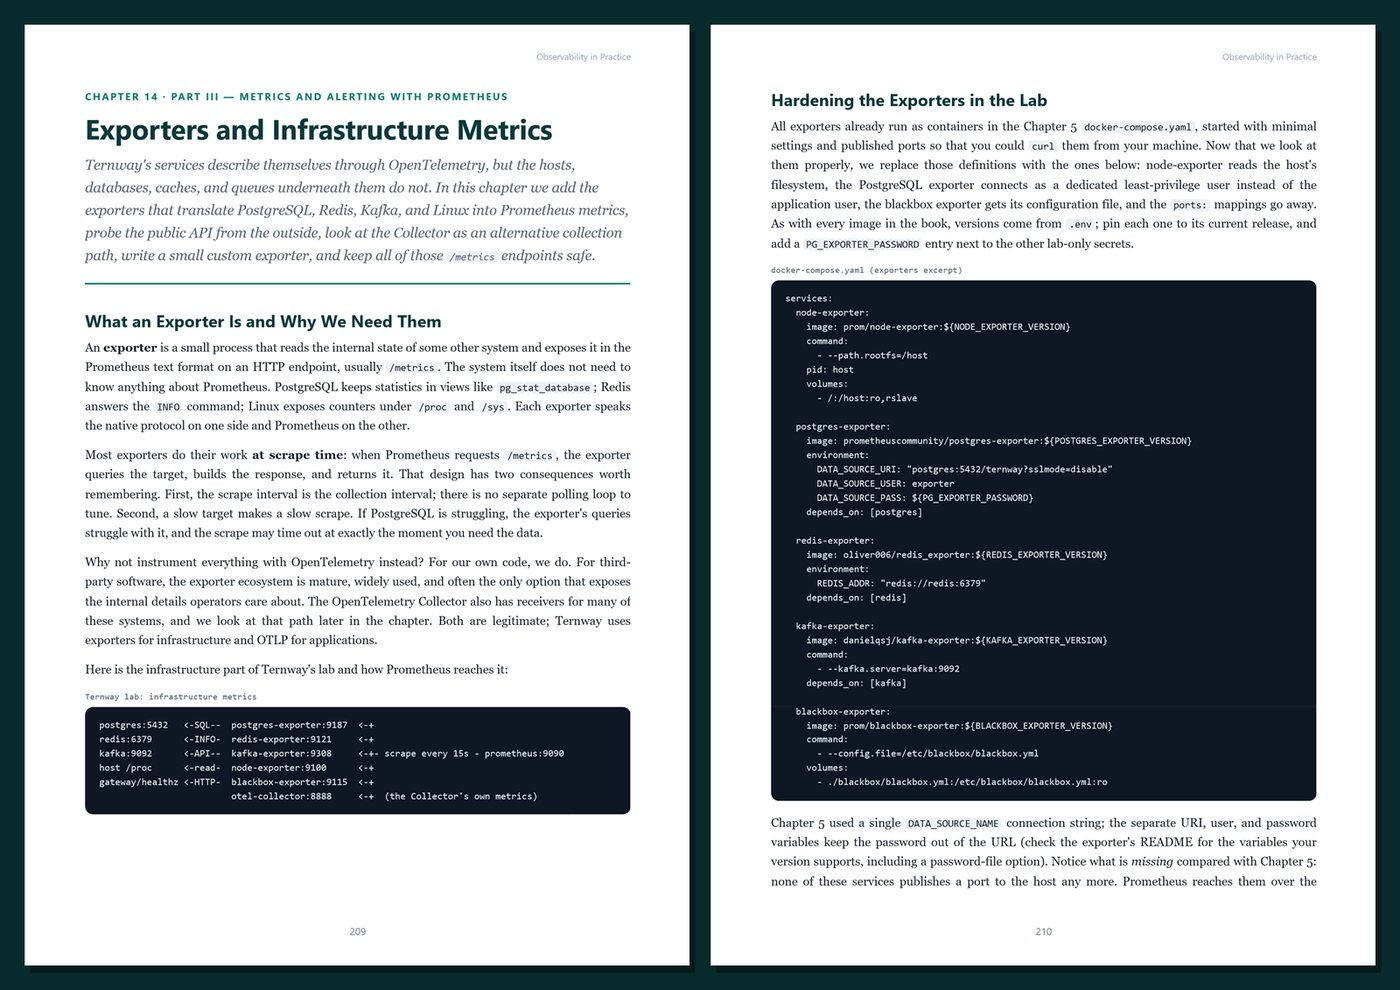
- Prometheus: data model, scraping, OTLP ingestion, PromQL from rates to histogram percentiles and joins, exporters, recording rules, alerting rules, and Alertmanager
- Grafana dashboards that answer questions, logs with Loki and LogQL, traces with Tempo and Jaeger, and exemplars that jump from a latency spike straight to the slow trace
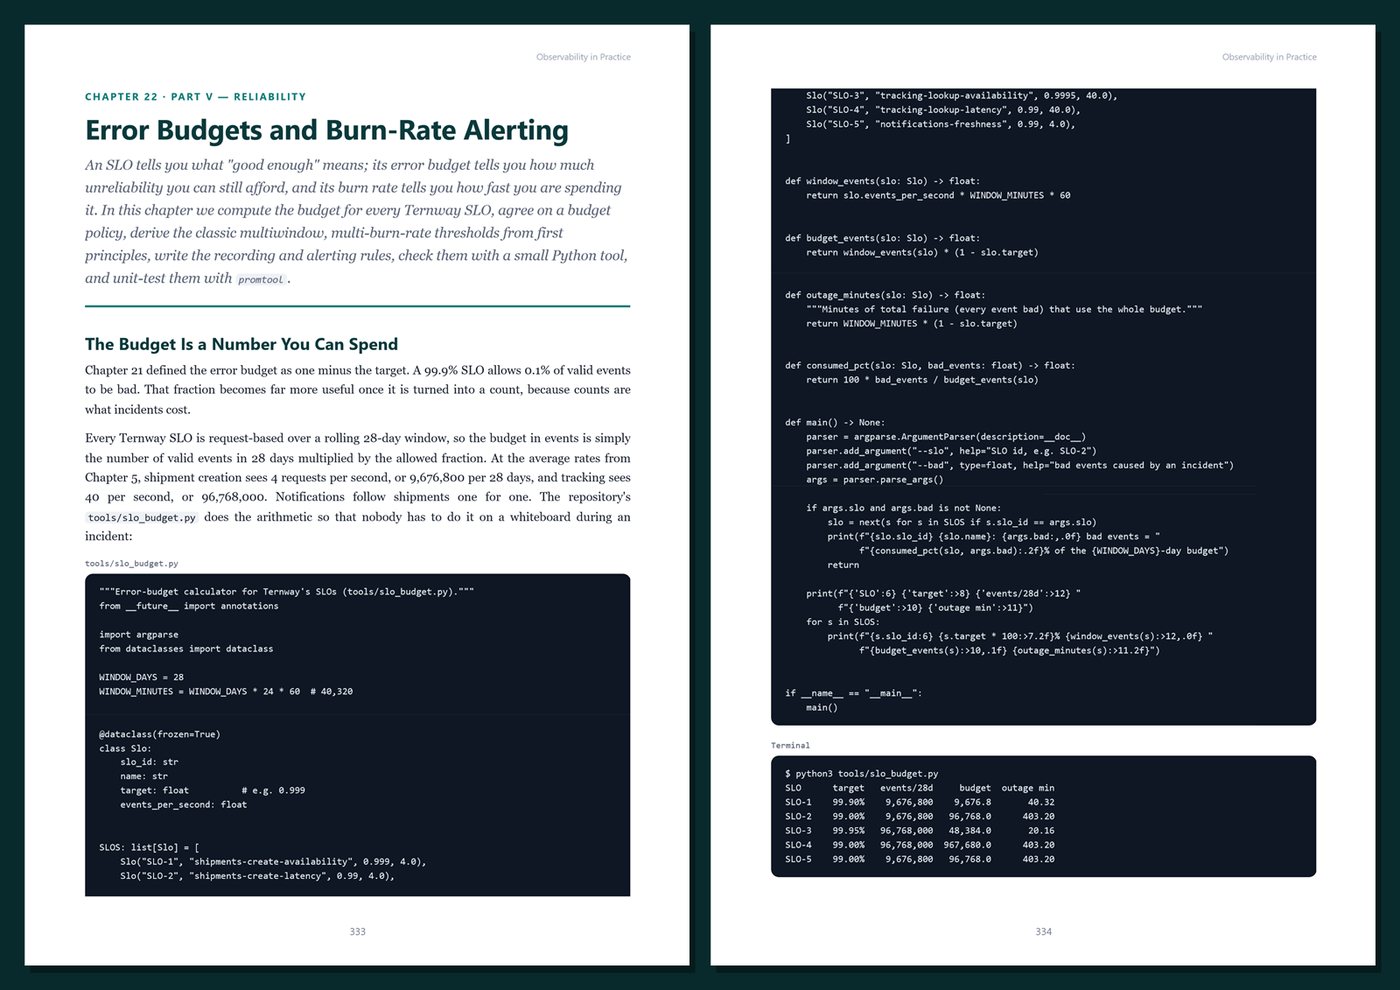
- SLIs, SLOs, error budgets, and multiwindow multi-burn-rate alerts — with every number worked out
- Alerting on symptoms, runbooks, on-call practices, incident response, and blameless postmortems
- Kubernetes observability, cardinality and cost control, operating and securing the observability stack, and an overview of continuous profiling and eBPF
One running example, start to finish. You instrument Ternway, a fictional parcel-delivery platform with five microservices — a Node.js gateway, Python orders and dispatch services, a Node.js tracking service, and a Java notifications service — plus PostgreSQL, Redis, and Kafka. You follow one shipment through every service, define five SLOs, and investigate incidents from a slow database query to a cardinality explosion, ending with a complete peak-week case study. Every number is consistent across chapters so you can check the arithmetic yourself.
Current and honest. The book targets recent OpenTelemetry SDKs and Collector releases, Prometheus 3.x, recent Grafana versions, Loki 3.x, Tempo 2.x, and Jaeger v2. Components that are still experimental or in development are clearly labeled, and the book contains no invented benchmarks, statistics, or vendor prices. Every chapter includes configuration, code, queries, Tips, Notes, Warnings, exercises, and Key Takeaways, and the appendices give you a cheat sheet, ready-to-use templates (Collector, Prometheus, rules, rule tests, Alertmanager, Grafana provisioning, runbooks, postmortems), a production checklist, and a glossary.
Format: PDF, 470 pages (A4), linked table of contents and bookmarks. English. First Edition, 2026. Published by thenexbooks. This book is independent and is not affiliated with, sponsored by, or endorsed by the OpenTelemetry project, the Prometheus project, the Cloud Native Computing Foundation, The Linux Foundation, or Grafana Labs.
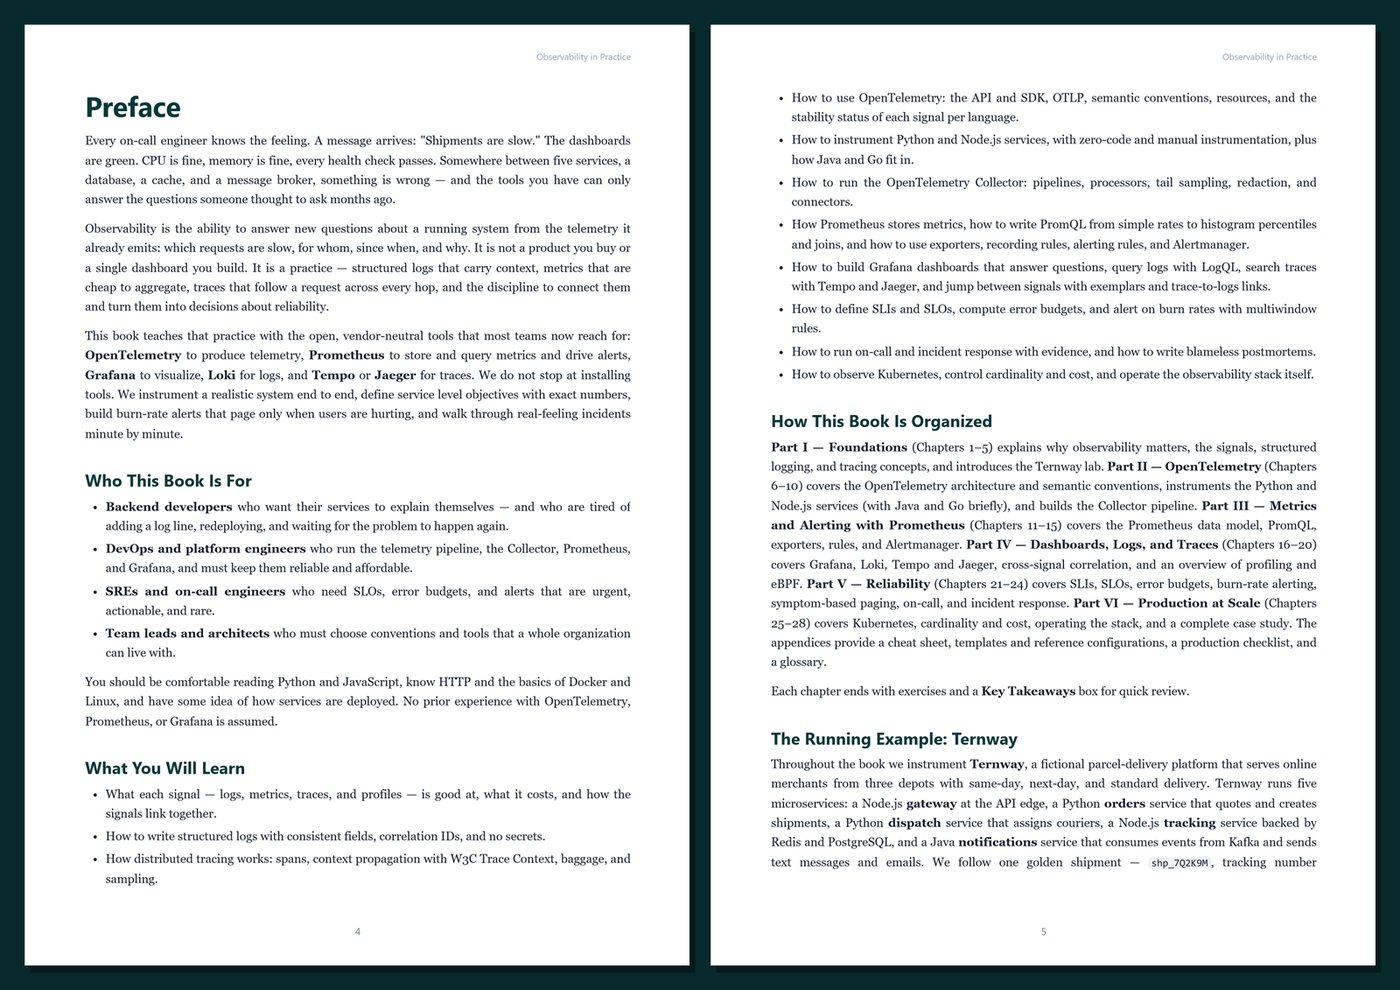
Table of Contents
Part I — Foundations
- Ch 1 · Why Observability: Beyond Dashboards and Health Checks
- Ch 2 · The Signals: Logs, Metrics, Traces, and Profiles
- Ch 3 · Structured Logging Done Right
- Ch 4 · Distributed Tracing Concepts: Spans, Context, and Propagation
- Ch 5 · Meet Ternway: Architecture, the Lab Stack, and Conventions
Part II — OpenTelemetry
- Ch 6 · OpenTelemetry Architecture: API, SDK, OTLP, and Stability
- Ch 7 · Semantic Conventions and Resources: Naming Telemetry Consistently
- Ch 8 · Instrumenting Python Services: Orders and Dispatch
- Ch 9 · Instrumenting Node.js Services, with Go and Java Briefly
- Ch 10 · The OpenTelemetry Collector: Pipelines, Processors, and Sampling
Part III — Metrics and Alerting with Prometheus
- Ch 11 · Prometheus Fundamentals: Data Model, Scraping, and OTLP Ingestion
- Ch 12 · PromQL from First Principles: Selectors, Rates, and Aggregation
- Ch 13 · PromQL in Practice: Histograms, Percentiles, and Joins
- Ch 14 · Exporters and Infrastructure Metrics
- Ch 15 · Recording Rules, Alerting Rules, and Alertmanager
Part IV — Dashboards, Logs, and Traces
- Ch 16 · Grafana Dashboards That Answer Questions
- Ch 17 · Logs with Loki and LogQL
- Ch 18 · Trace Backends: Tempo and Jaeger
- Ch 19 · Connecting the Signals: Exemplars, Trace-to-Logs, and Correlation
- Ch 20 · Continuous Profiling and eBPF: An Overview
Part V — Reliability
- Ch 21 · SLIs and SLOs: Measuring What Users Feel
- Ch 22 · Error Budgets and Burn-Rate Alerting
- Ch 23 · Alerting on Symptoms: Pages That Matter
- Ch 24 · On-Call and Incident Response with Observability
Part VI — Production at Scale
- Ch 25 · Kubernetes Observability
- Ch 26 · Cardinality, Cost, and Retention Control
- Ch 27 · Operating the Observability Stack: Scaling, Reliability, and Security
- Ch 28 · Case Study: Ternway Peak Week, End to End
Appendices
A · Observability Cheat Sheet
B · Templates and Reference
C · Production Checklist
D · Glossary
Book details
| Detail | |
|---|---|
| Pages | 470 |
| Format | PDF (A4) |
| Language | English |
| Level | Intermediate |
| Edition | 1st Edition (2026) |
| Download on this site | Free sample, first 20 pages (PDF) |
| Publisher | thenexbooks |
Files you get
No reviews yet. Only buyers can review.
More from thenexbooks