 1 / 11
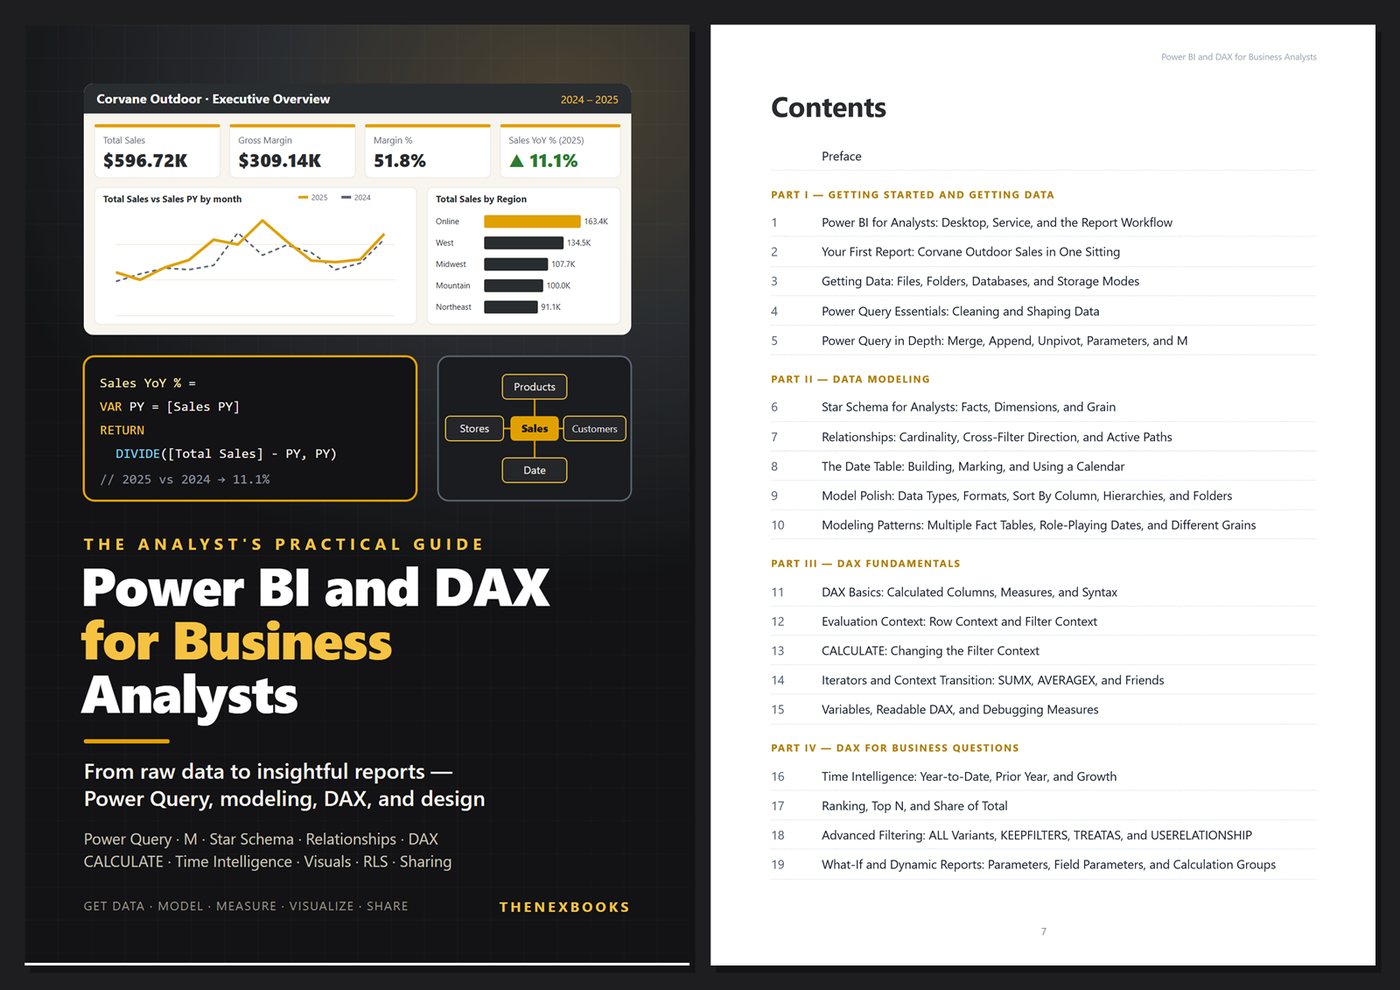
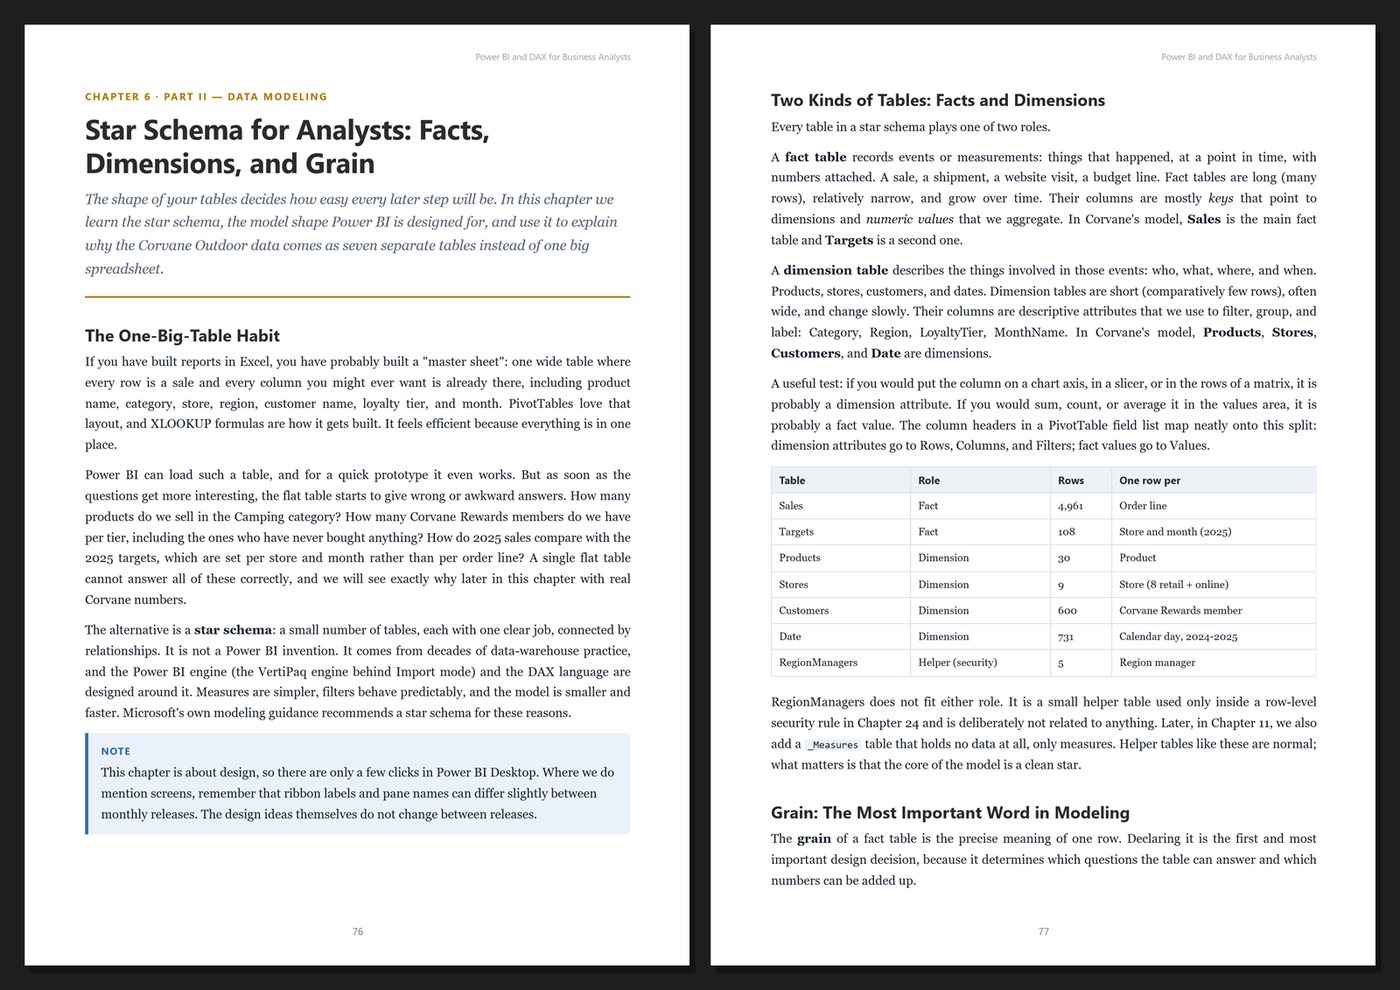
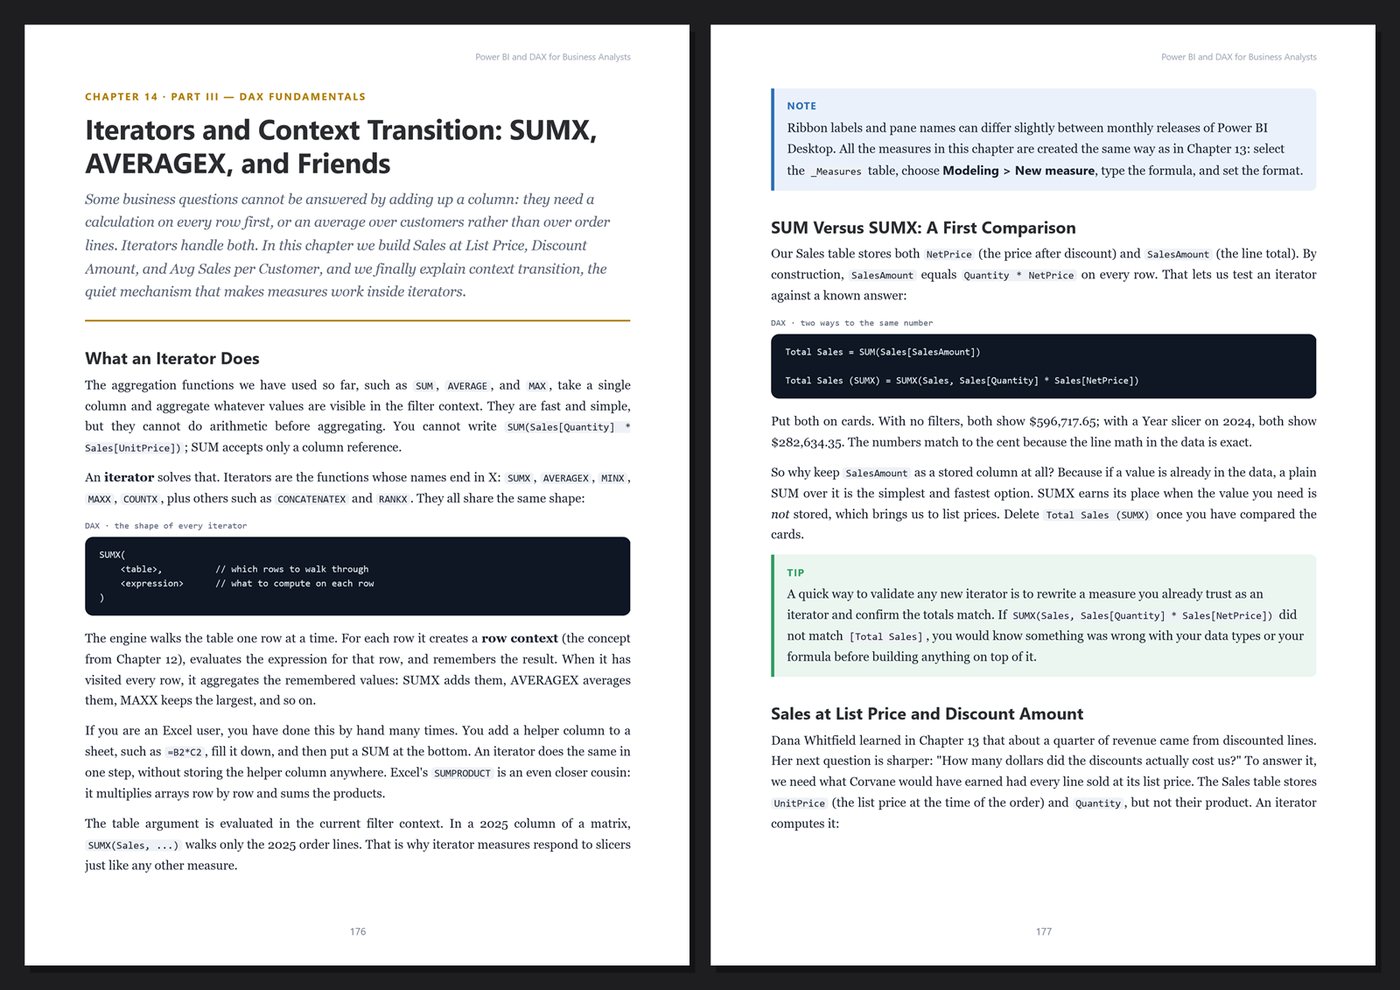
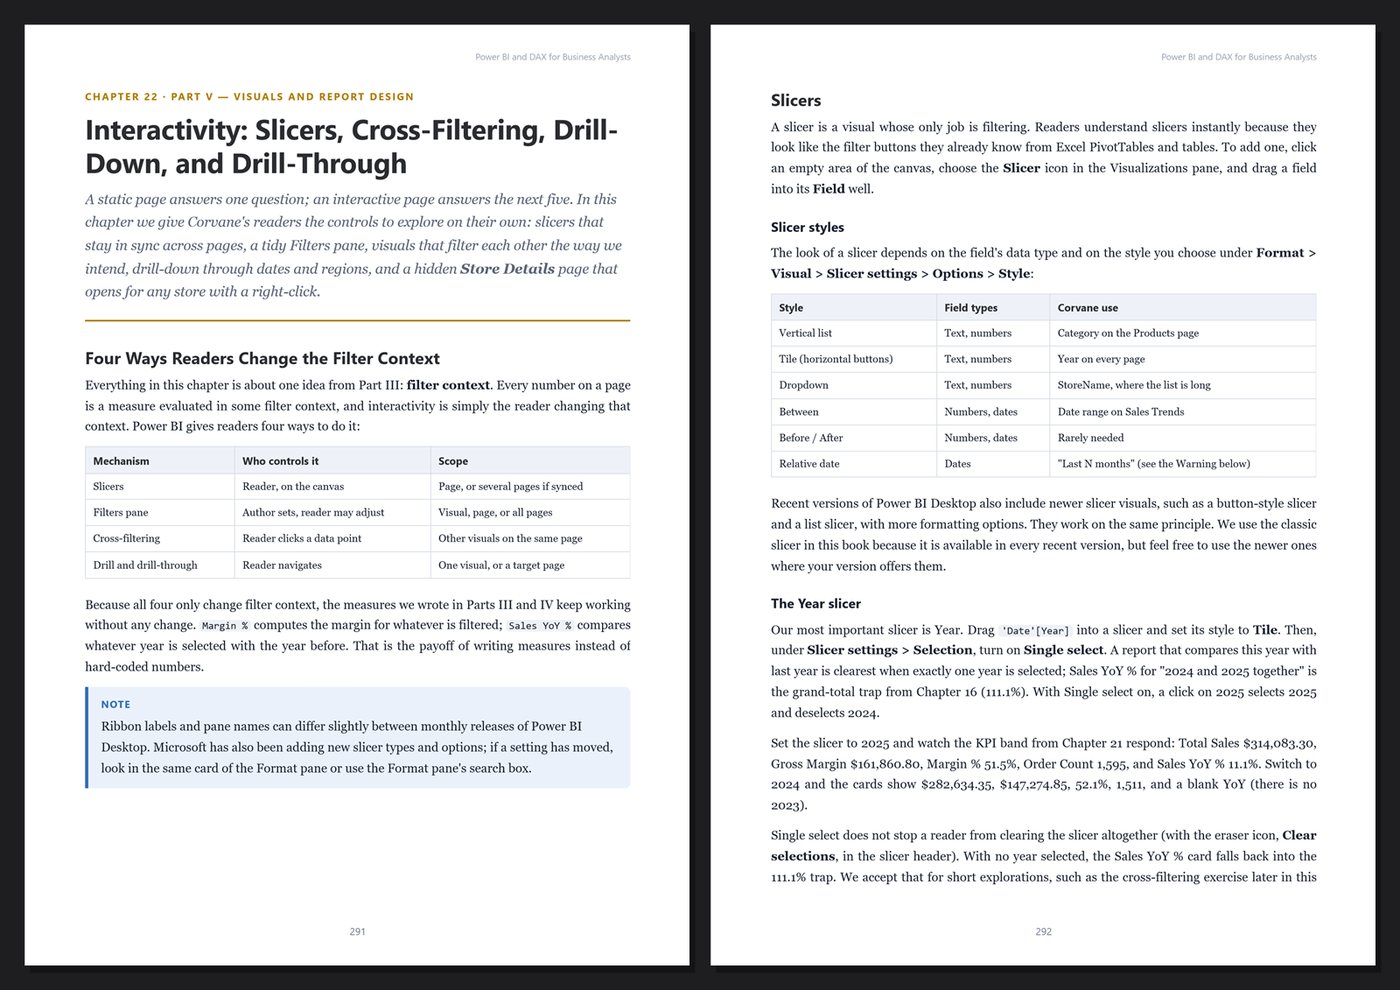
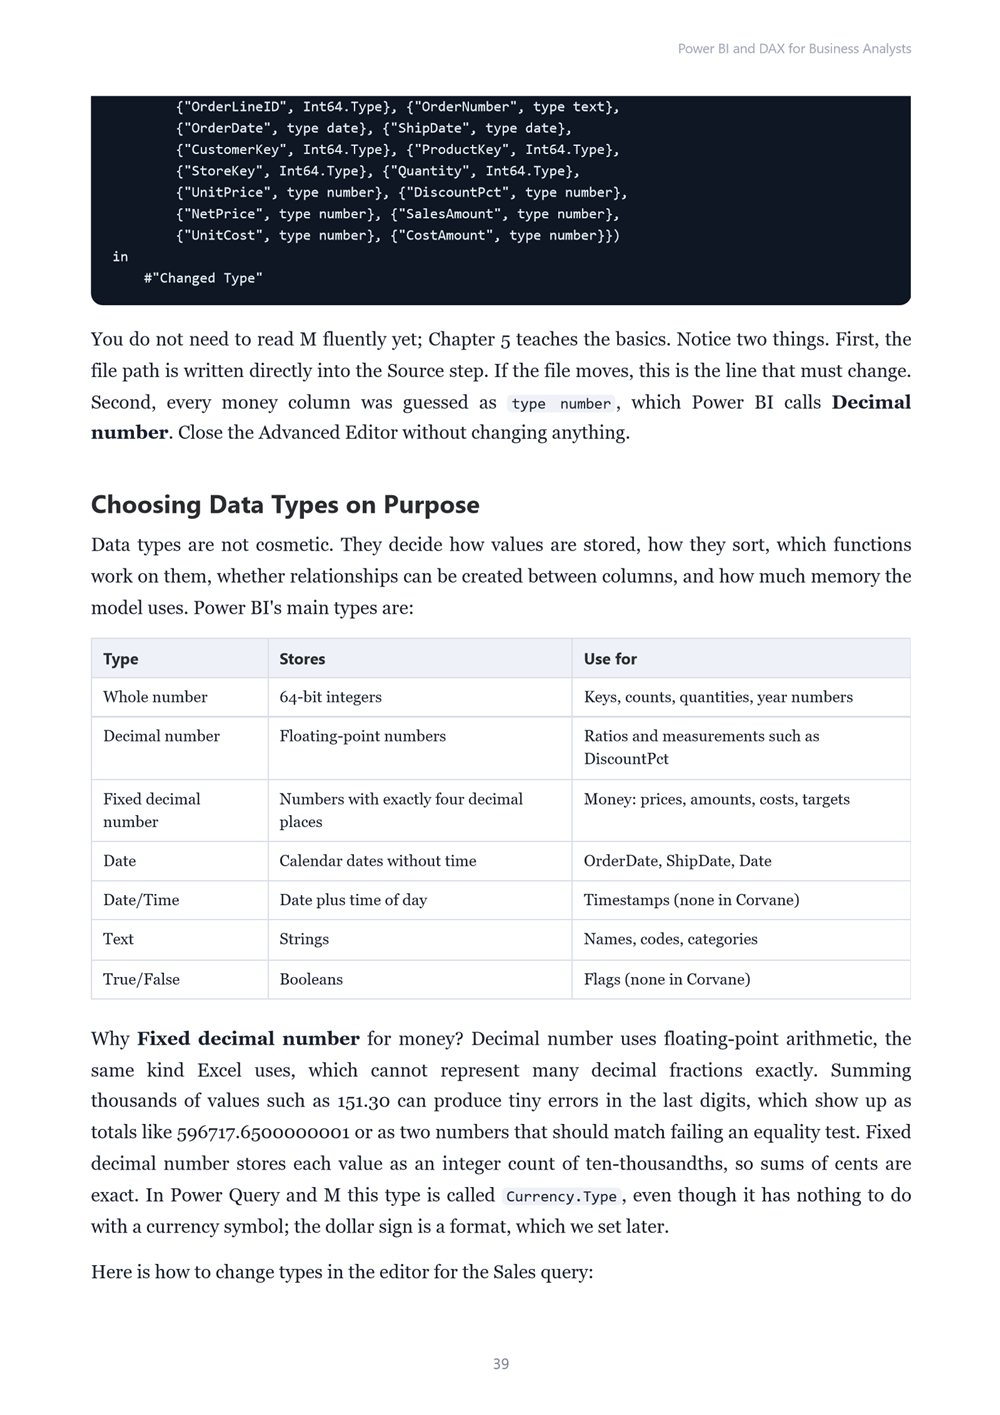
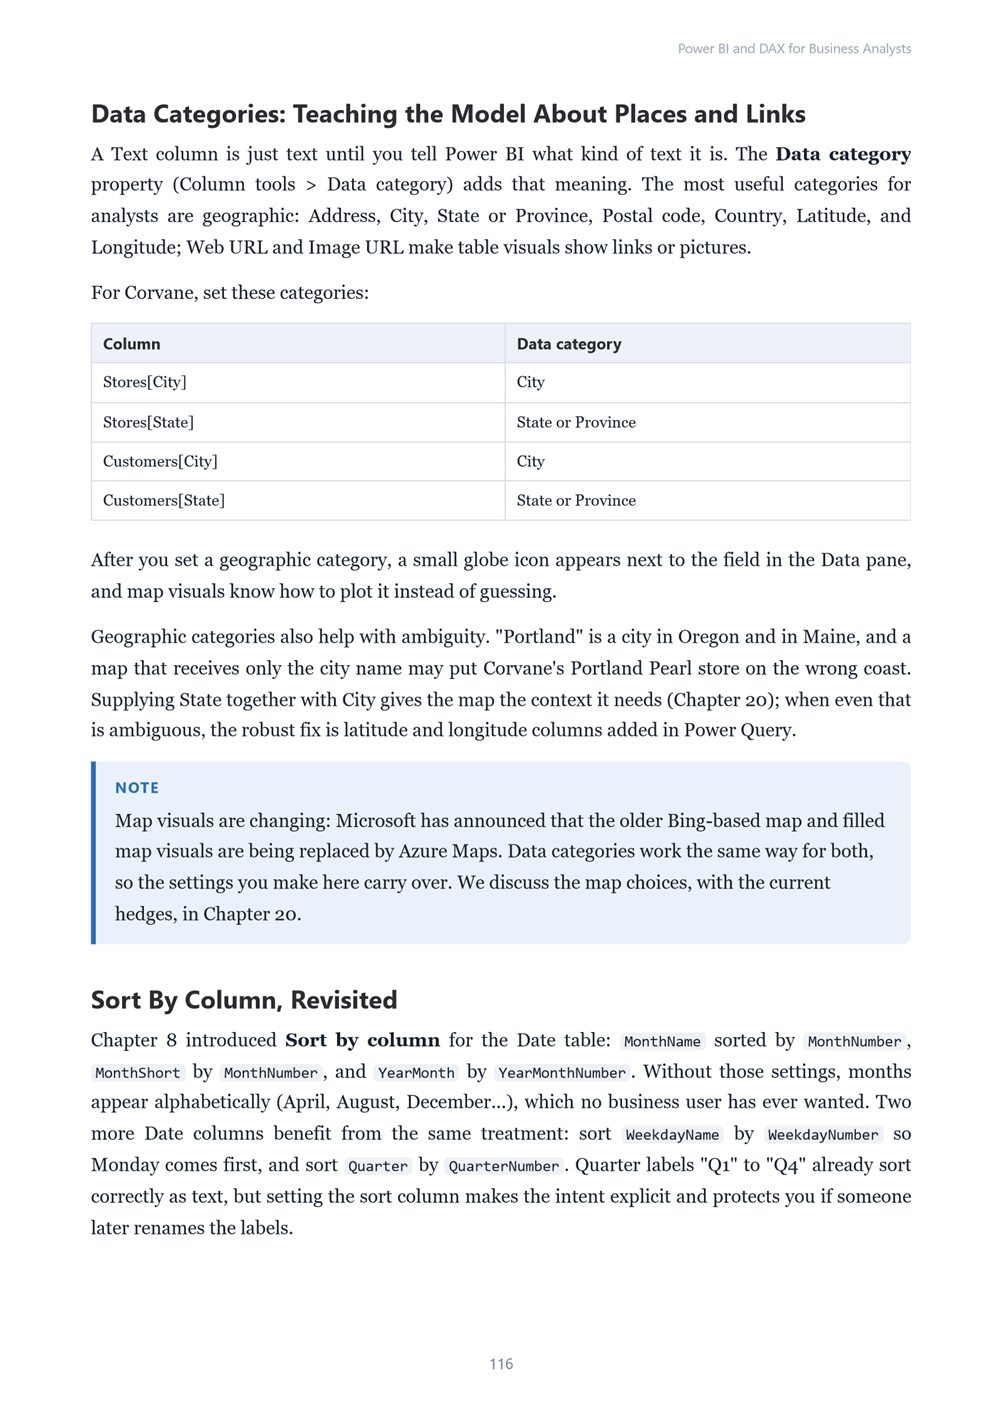
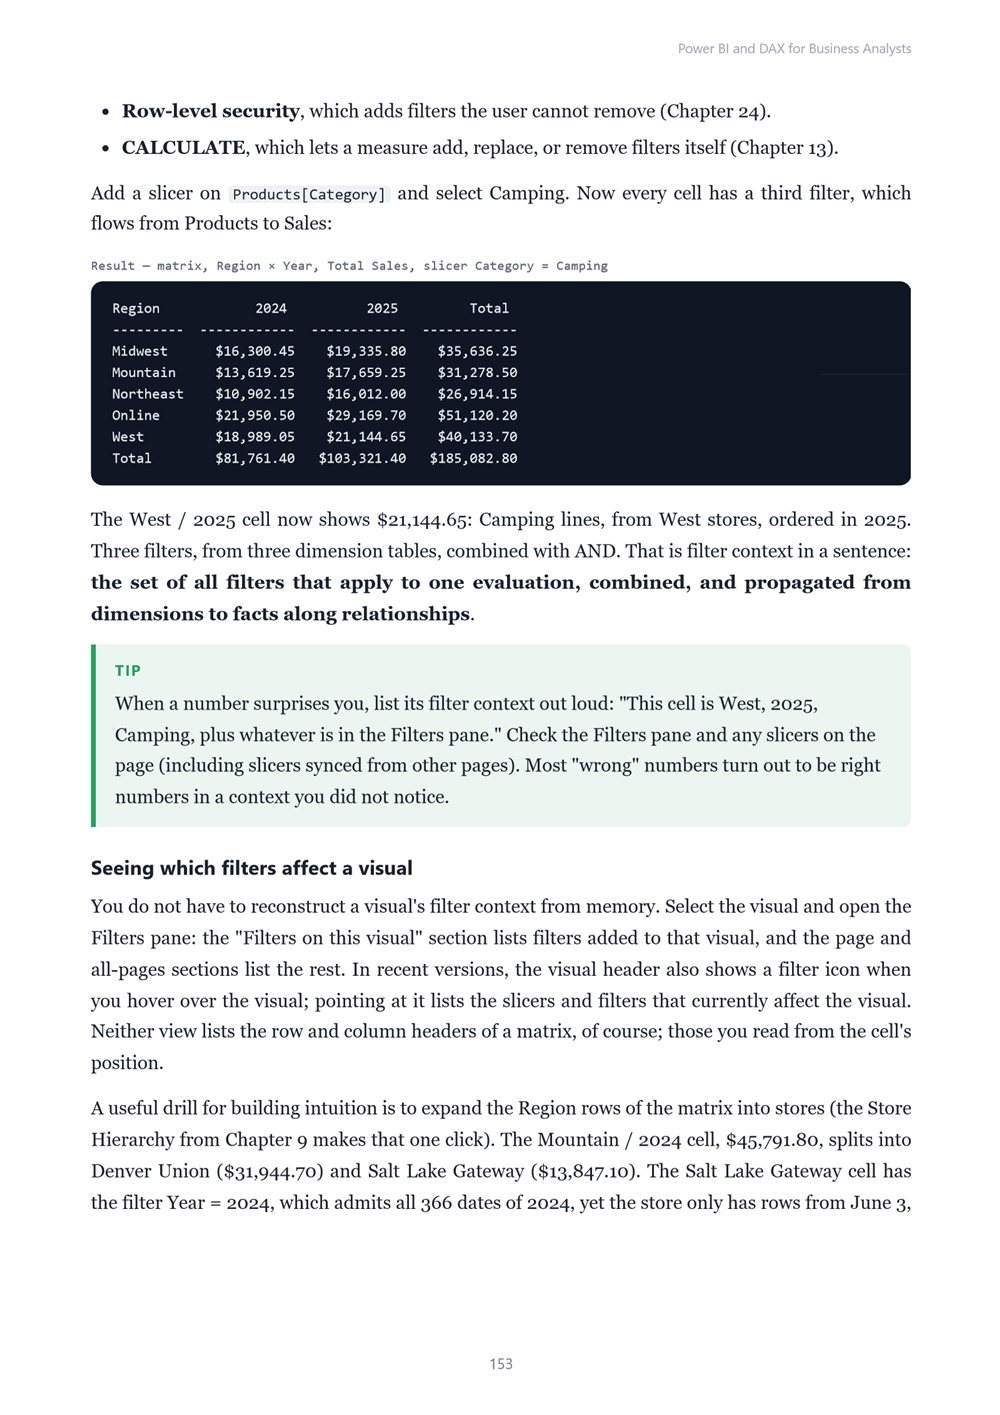
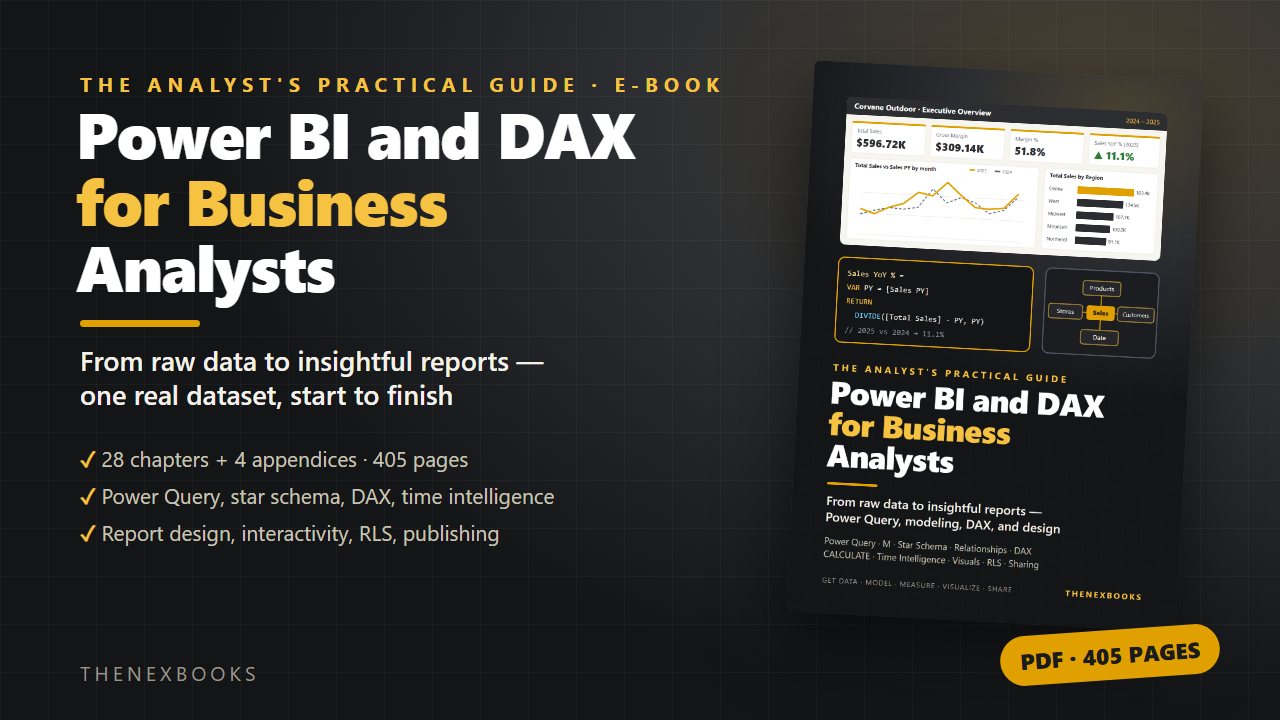
Learn Power BI and DAX the way business analysts use them and build one complete sales report from raw CSV files: Power Query and M, star-schema modeling, relationships, a proper date table, DAX measures, evaluation context, CALCULATE, iterators, time intelligence, ranking, what-if parameters…
From Raw Data to Insightful Reports
Read before you buy: the PDF here is a free sample — the first 20 pages of the 405-page book (payments, sales and reviews on this demo site are sample data). Get the full e-book at thenexbooks on Gumroad.
Stop rebuilding the same report every month. Build it once, correctly, and let it refresh.
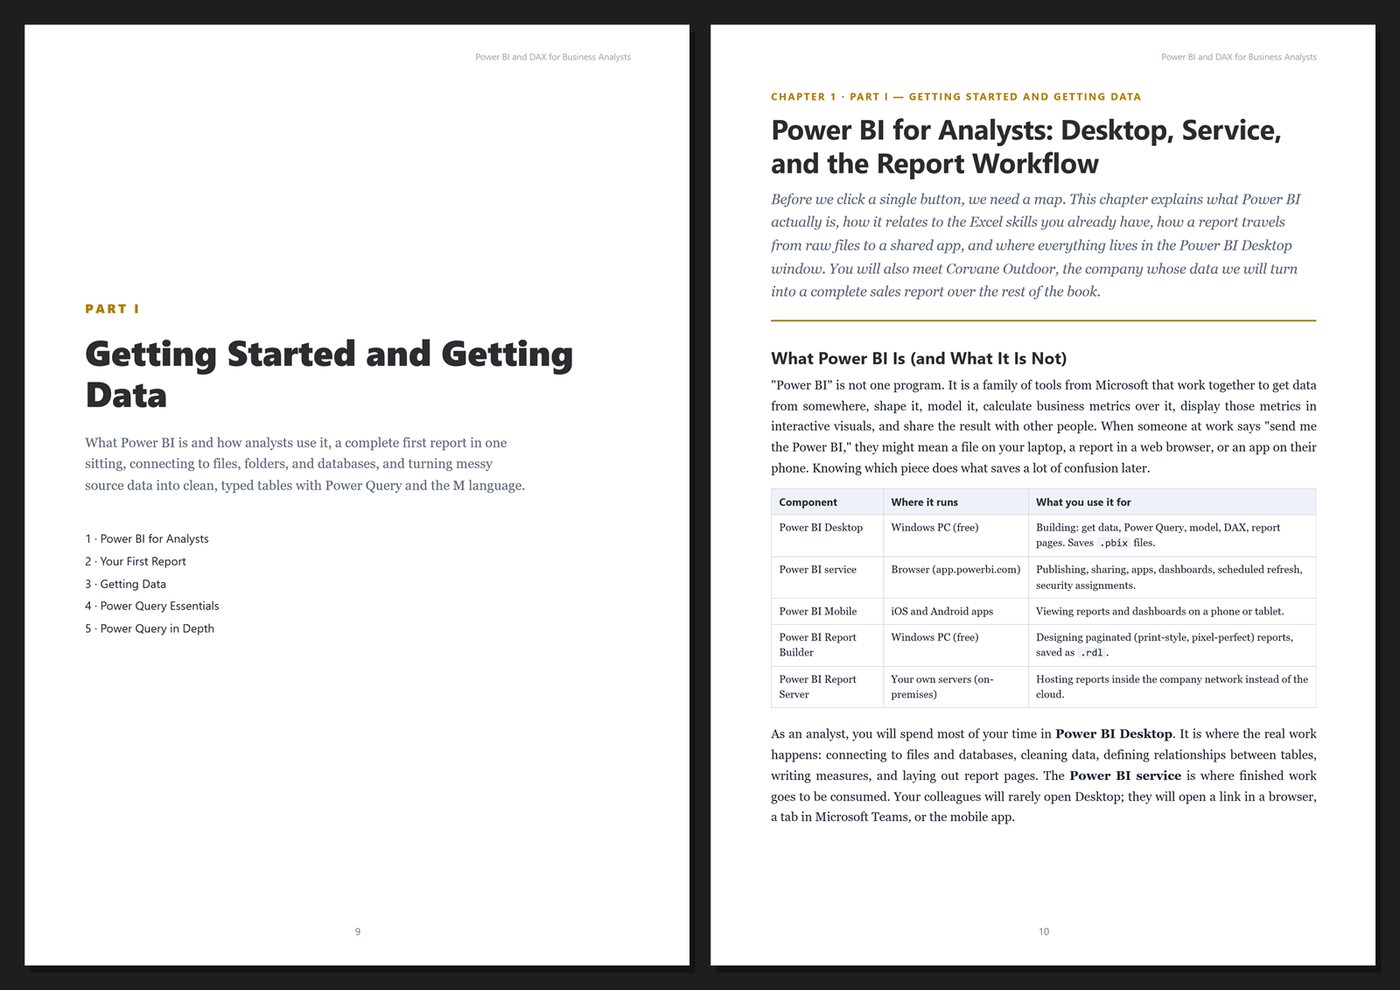
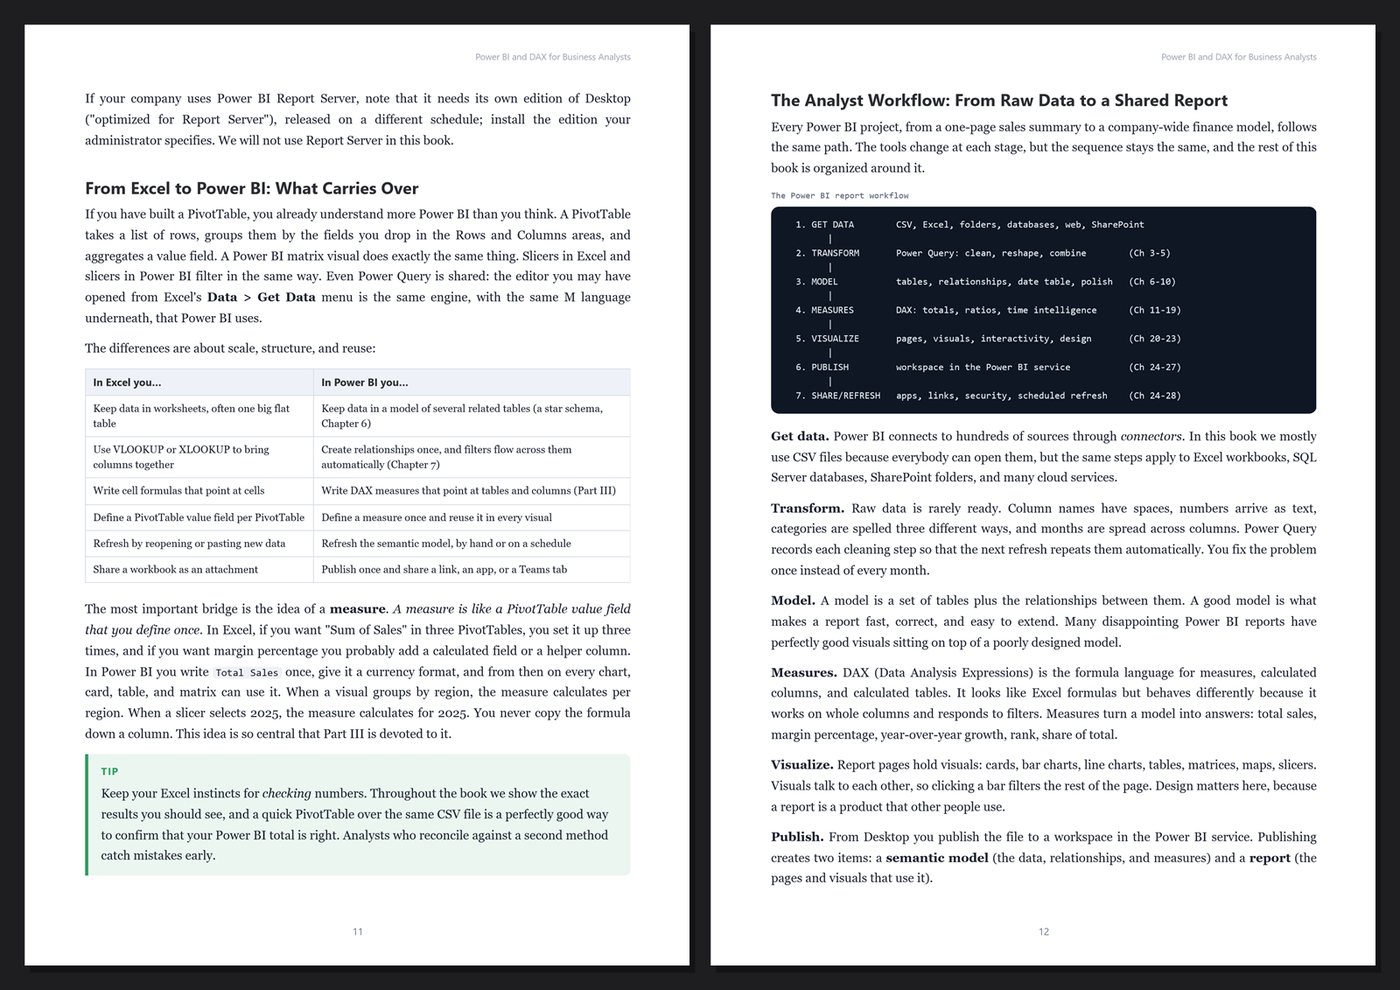
Most analysts spend more time preparing reports than thinking about what the numbers mean: export, paste, fix the columns, refresh the PivotTables, copy the charts, and start again when someone asks a follow-up question. Power BI changes that rhythm. You describe your cleaning steps once in Power Query, connect your tables once in a model, and write each measure once in DAX — and every card, chart, and table stays correct for every region, product, and month.
This book teaches Power BI and DAX from the ground up for business analysts and Excel users. You do not just tour the buttons: you take one realistic dataset from messy files to a published, secured, interactive report, and each feature appears at the moment it solves a real problem.
What's inside
- How Power BI Desktop and the Power BI service fit together, and a complete first report in one sitting
- Getting data from CSV files, Excel, folders, and databases, plus Import, DirectQuery, and other storage modes
- Power Query step by step: data types and locales, trimming and cleaning, merges, appends, unpivoting, combining a folder of files, parameters, and the M language
- Data modeling for analysts: star schema, facts and dimensions, grain, relationships, cardinality, cross-filter direction, active and inactive paths
- A proper date table: building it three ways, marking it, sorting months correctly, and turning off Auto date/time
- DAX fundamentals: calculated columns vs measures, row context and filter context, CALCULATE, context transition, iterators, and variables
- DAX for business questions: year-to-date, prior year, growth, rolling periods, rankings, top N, share of total, targets and variances, what-if and field parameters, and calculation groups
- Report design: choosing the right visual, layout, a custom theme, conditional formatting, and accessibility
- Interactivity: slicers, cross-filtering, drill-down, drill-through, report page tooltips, bookmarks, buttons, and navigation
- Row-level security with static and dynamic roles
- Performance: Performance Analyzer, model size, DAX query view, and third-party tools such as DAX Studio
- Publishing and sharing: workspaces, apps, scheduled refresh, gateways, deployment pipelines, and an overview of Microsoft Fabric and paginated reports
- A capstone project that brings everything together in a five-page sales dashboard
One running example, start to finish. You work as an analyst for Corvane Outdoor, a fictional outdoor-gear retailer with eight stores in four US regions plus an online store. Starting from raw CSV files — some deliberately messy — you build the Corvane Sales report: a clean star-schema model, a tested library of DAX measures, five report pages with drill-through and tooltips, security for regional managers, and a published app. The sample data comes as a companion download (CorvaneBI-sample-data.zip), so every number in the text matches exactly what you see when you load the same files.
Current and honest. The book targets recent monthly releases of Power BI Desktop and the Power BI service, labels preview features as preview, and explains licensing concepts without quoting prices or limits that change over time. It contains no invented benchmarks or statistics. Every chapter includes step-by-step instructions, DAX and M code, Tips, Notes, Warnings, exercises, and Key Takeaways, and the appendices give you a cheat sheet, templates and reference material, a production checklist, and a glossary.
Format: PDF, 405 pages (A4), linked table of contents and bookmarks, plus the companion sample data (CSV files in a ZIP). English. First Edition, 2026. Published by thenexbooks. Power BI Desktop runs on Windows. This book is independent and is not affiliated with, sponsored by, or endorsed by Microsoft Corporation.
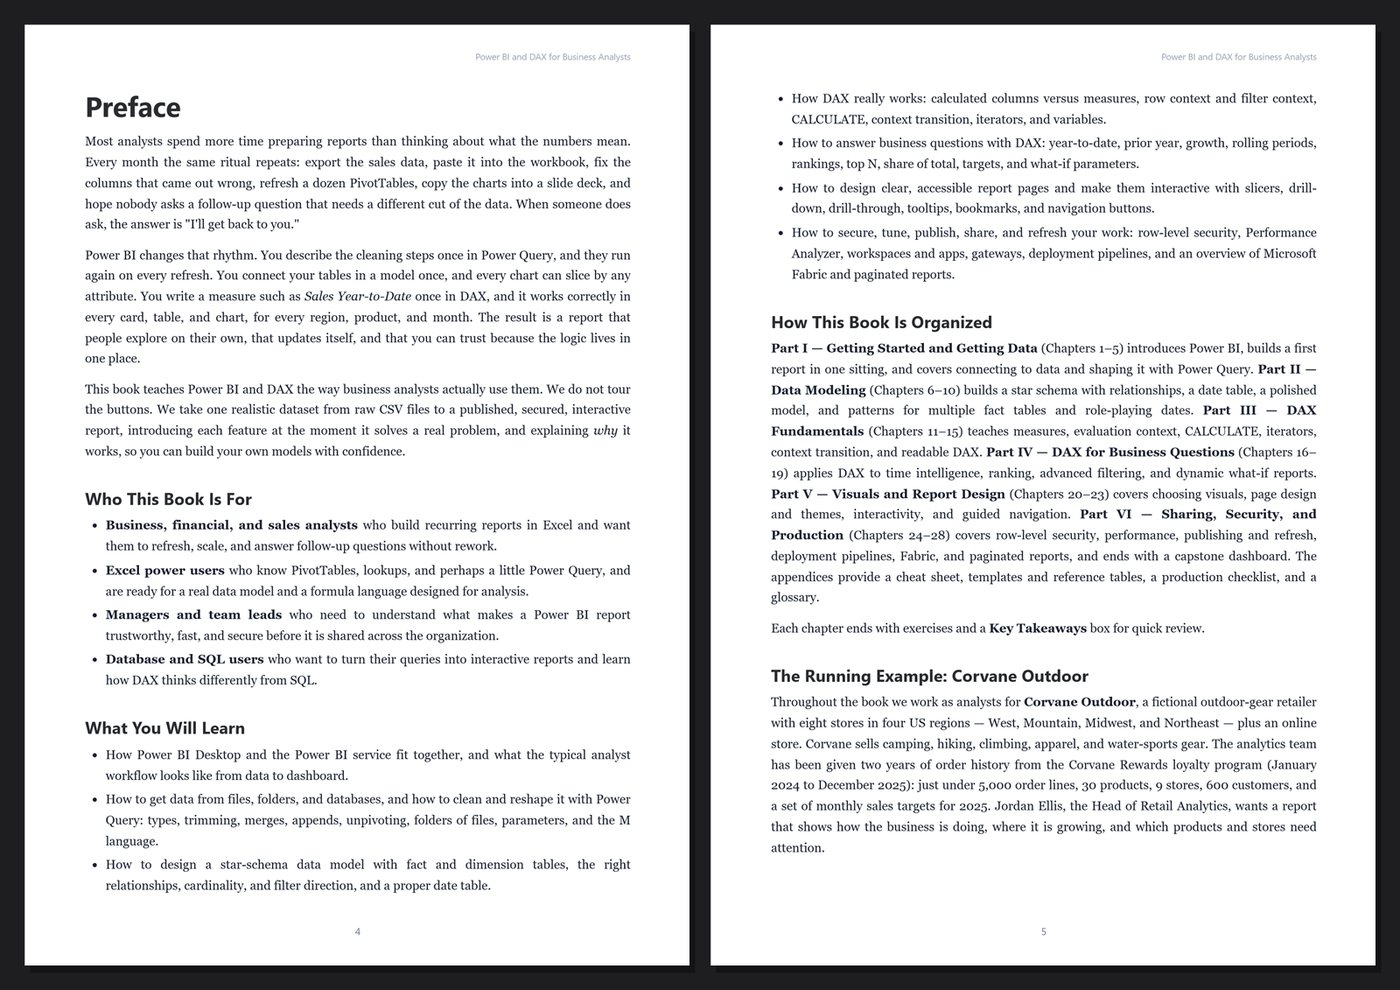
Table of Contents
Part I — Getting Started and Getting Data
- Ch 1 · Power BI for Analysts: Desktop, Service, and the Report Workflow
- Ch 2 · Your First Report: Corvane Outdoor Sales in One Sitting
- Ch 3 · Getting Data: Files, Folders, Databases, and Storage Modes
- Ch 4 · Power Query Essentials: Cleaning and Shaping Data
- Ch 5 · Power Query in Depth: Merge, Append, Unpivot, Parameters, and M
Part II — Data Modeling
- Ch 6 · Star Schema for Analysts: Facts, Dimensions, and Grain
- Ch 7 · Relationships: Cardinality, Cross-Filter Direction, and Active Paths
- Ch 8 · The Date Table: Building, Marking, and Using a Calendar
- Ch 9 · Model Polish: Data Types, Formats, Sort By Column, Hierarchies, and Folders
- Ch 10 · Modeling Patterns: Multiple Fact Tables, Role-Playing Dates, and Different Grains
Part III — DAX Fundamentals
- Ch 11 · DAX Basics: Calculated Columns, Measures, and Syntax
- Ch 12 · Evaluation Context: Row Context and Filter Context
- Ch 13 · CALCULATE: Changing the Filter Context
- Ch 14 · Iterators and Context Transition: SUMX, AVERAGEX, and Friends
- Ch 15 · Variables, Readable DAX, and Debugging Measures
Part IV — DAX for Business Questions
- Ch 16 · Time Intelligence: Year-to-Date, Prior Year, and Growth
- Ch 17 · Ranking, Top N, and Share of Total
- Ch 18 · Advanced Filtering: ALL Variants, KEEPFILTERS, TREATAS, and USERELATIONSHIP
- Ch 19 · What-If and Dynamic Reports: Parameters, Field Parameters, and Calculation Groups
Part V — Visuals and Report Design
- Ch 20 · Choosing the Right Visual: Charts, Tables, Matrices, and Cards
- Ch 21 · Report Design: Layout, Themes, Formatting, and Accessibility
- Ch 22 · Interactivity: Slicers, Cross-Filtering, Drill-Down, and Drill-Through
- Ch 23 · Guided Reports: Bookmarks, Buttons, Tooltips, and Navigation
Part VI — Sharing, Security, and Production
- Ch 24 · Row-Level Security: Static and Dynamic Roles
- Ch 25 · Performance: Performance Analyzer, Model Size, and DAX Studio
- Ch 26 · Publishing and Sharing: Workspaces, Apps, Refresh, and Gateways
- Ch 27 · Beyond the Desktop: Deployment Pipelines, Microsoft Fabric, and Paginated Reports
- Ch 28 · Capstone: Building the Corvane Outdoor Sales Dashboard
Appendices
A · Power BI and DAX Cheat Sheet
B · Templates and Reference
C · Production Checklist
D · Glossary
Book details
| Detail | |
|---|---|
| Pages | 405 |
| Format | PDF (A4) |
| Language | English |
| Level | Beginner to Intermediate |
| Edition | 1st Edition (2026) |
| Download on this site | Free sample, first 20 pages (PDF) |
| Publisher | thenexbooks |
Files you get
No reviews yet. Only buyers can review.
More from thenexbooks