 1 / 11
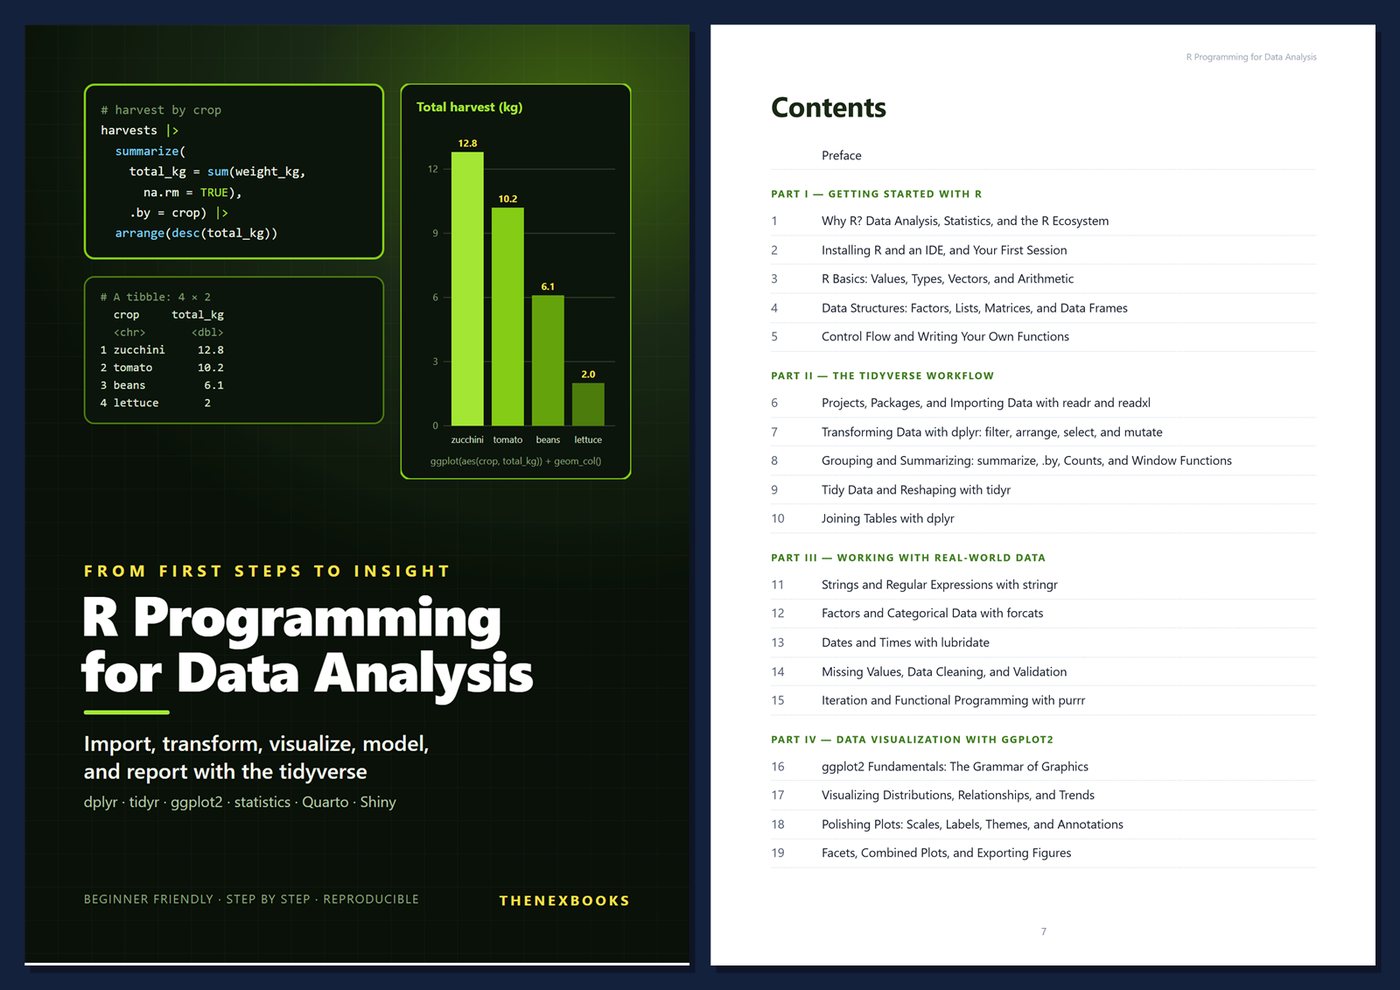
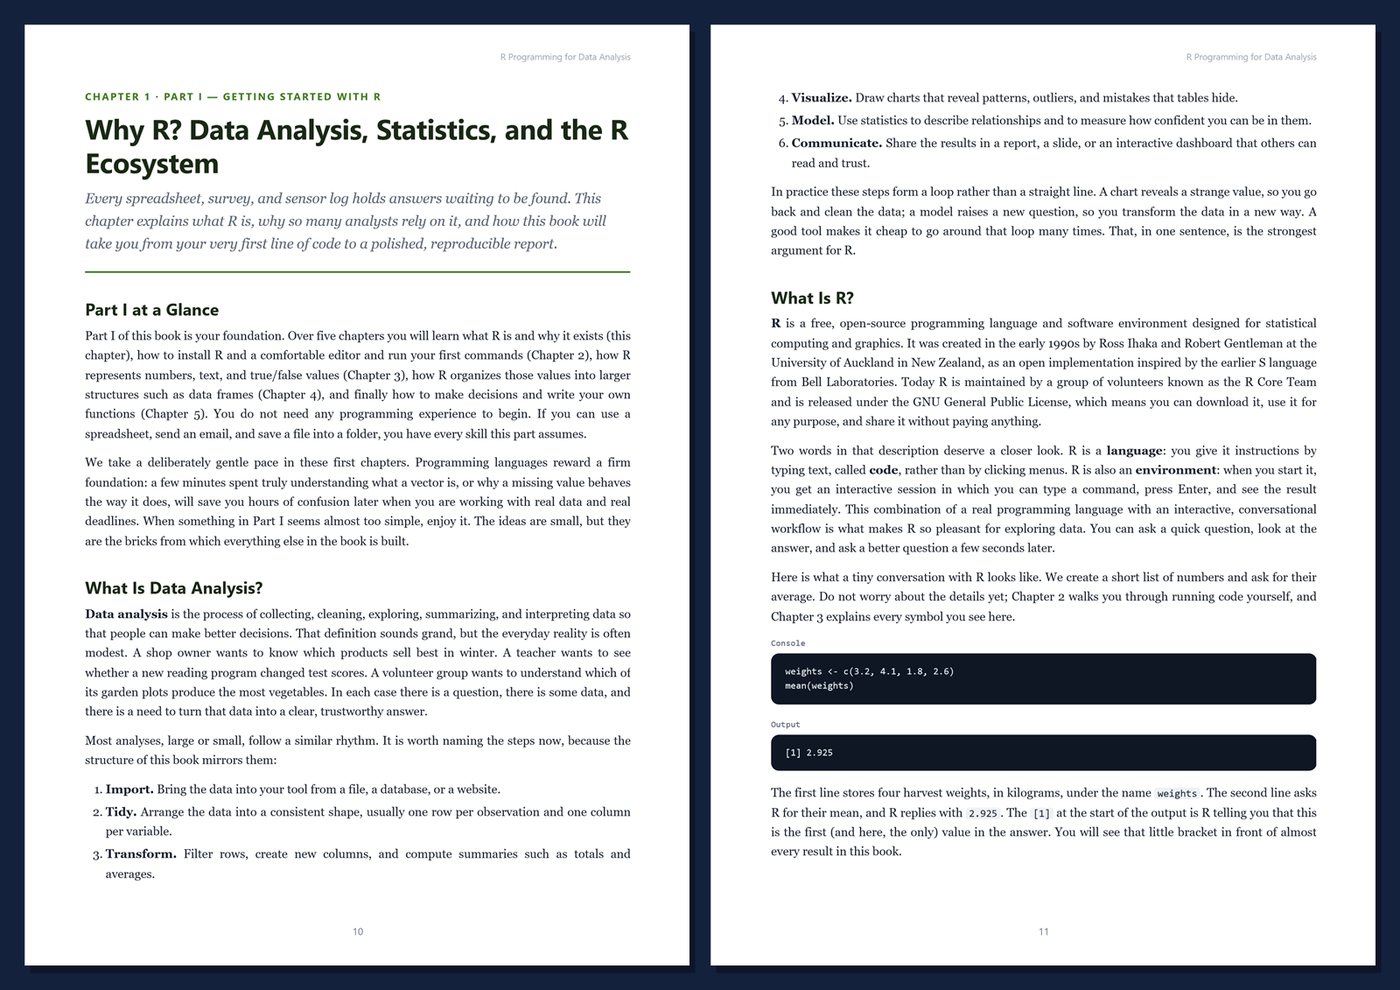
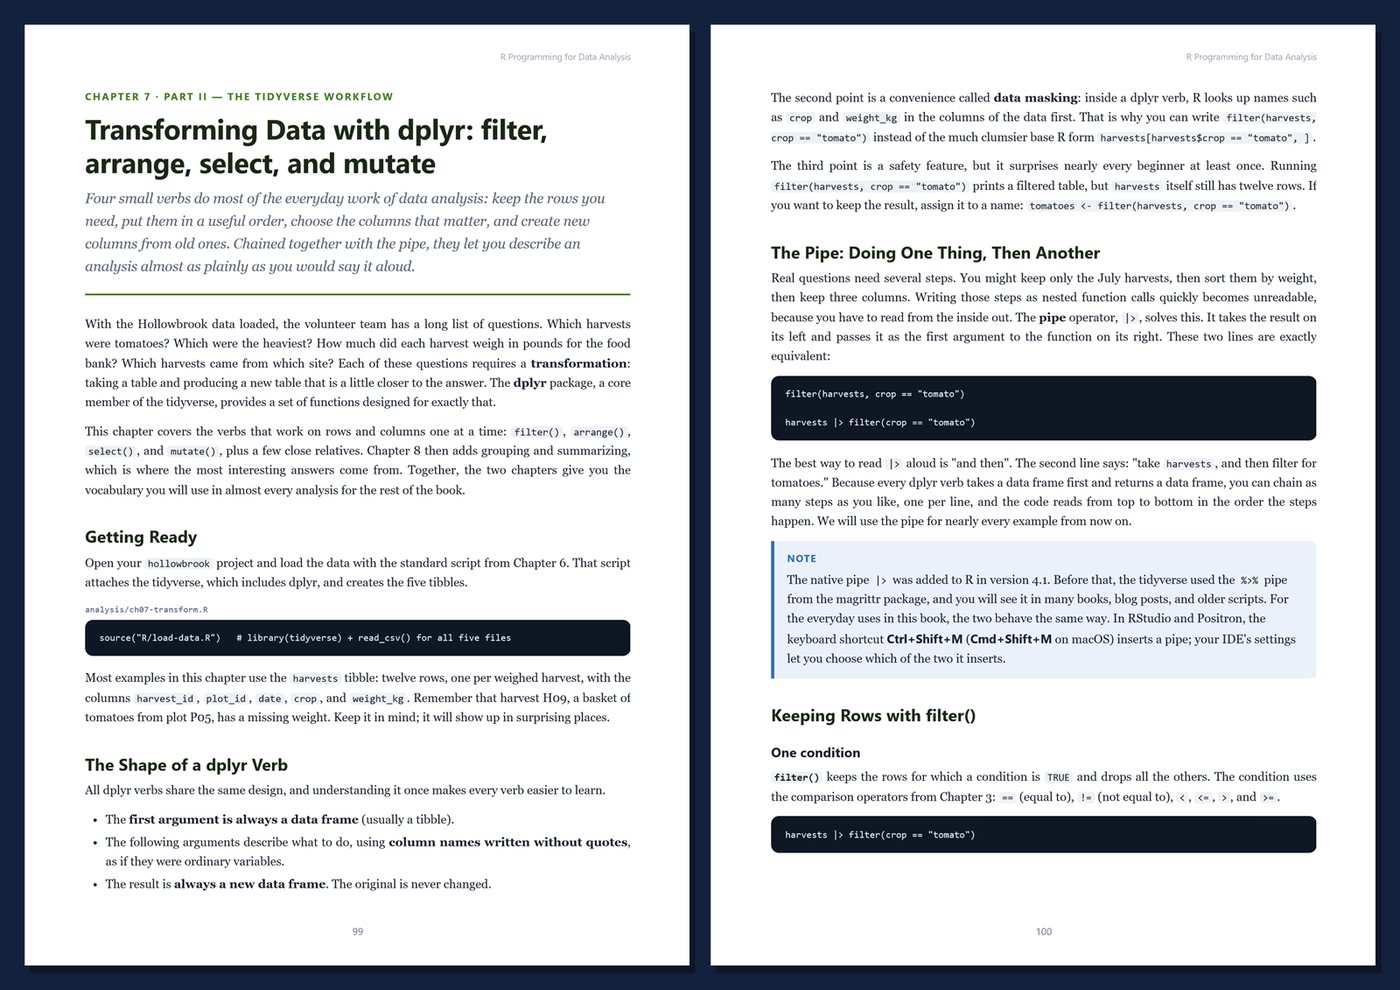
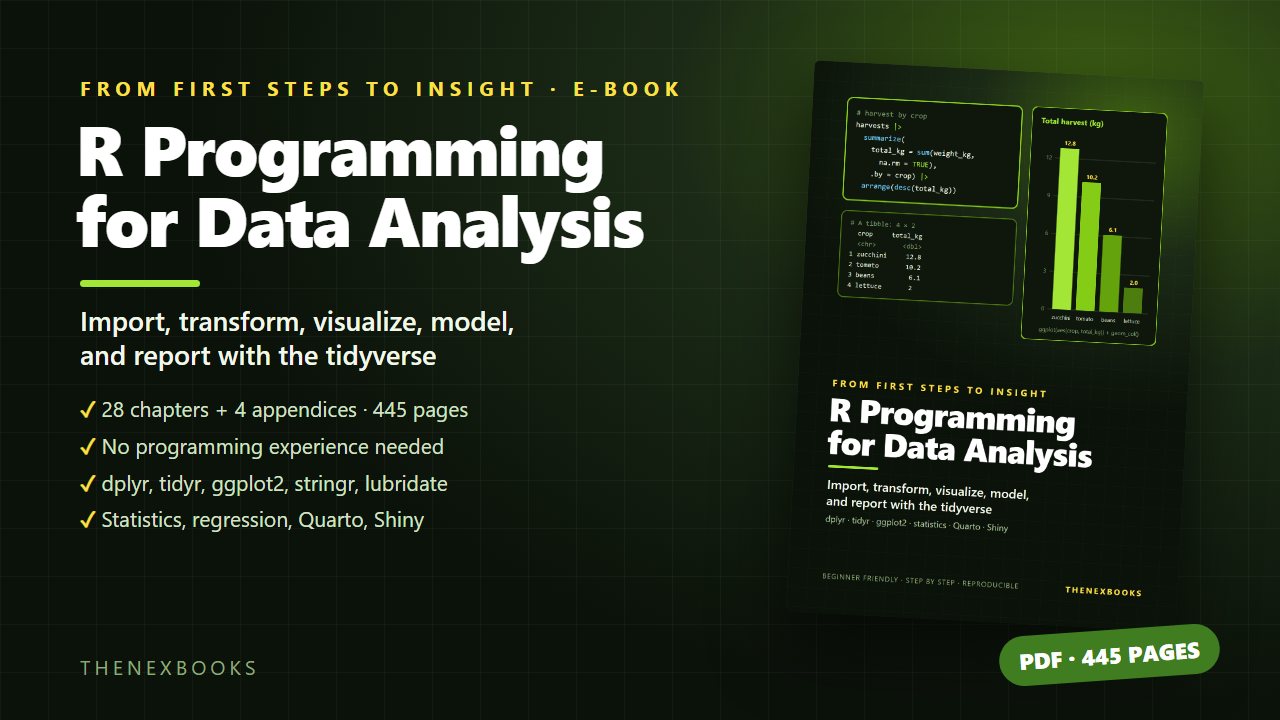
A 445-page step-by-step guide to R for data analysis: from your first line of code through dplyr, tidyr, ggplot2, and practical statistics to reproducible Quarto reports and Shiny dashboards — no programming experience needed.
From First Steps to Insightful Reports with the Tidyverse
Read before you buy: the PDF here is a free sample — the first 20 pages of the 445-page book (payments, sales and reviews on this demo site are sample data). Get the full e-book at thenexbooks on Gumroad.
Turn spreadsheets into answers — and answers into reports people trust.
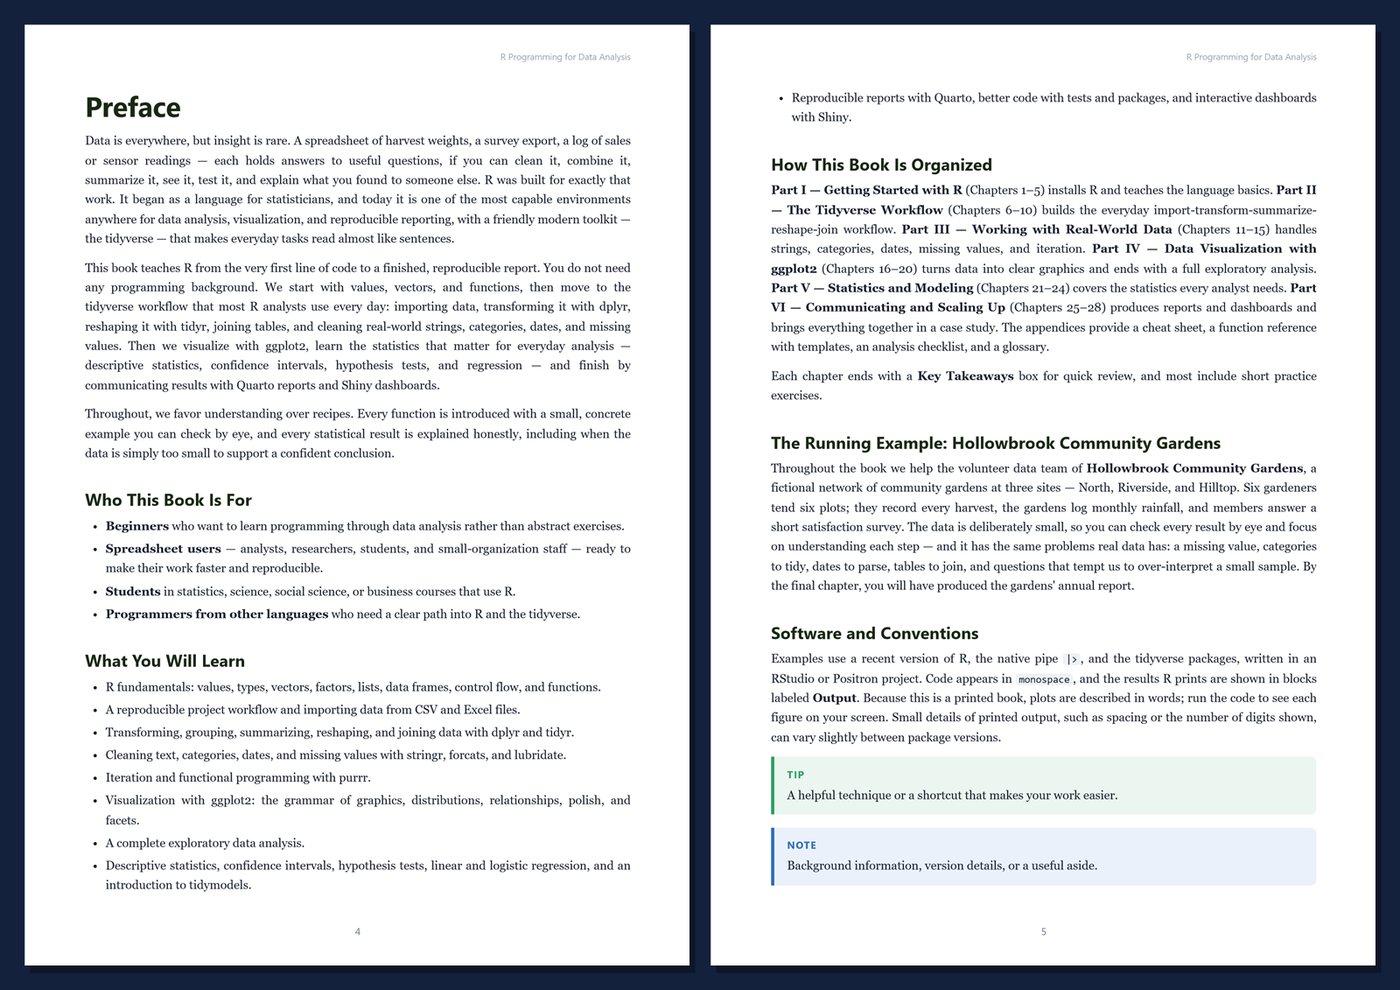
R is one of the most capable environments anywhere for data analysis, visualization, and reproducible reporting, and its modern toolkit — the tidyverse — makes everyday analysis read almost like plain sentences. This book teaches R from the very first line of code to a finished, reproducible report. You don't need any programming background.
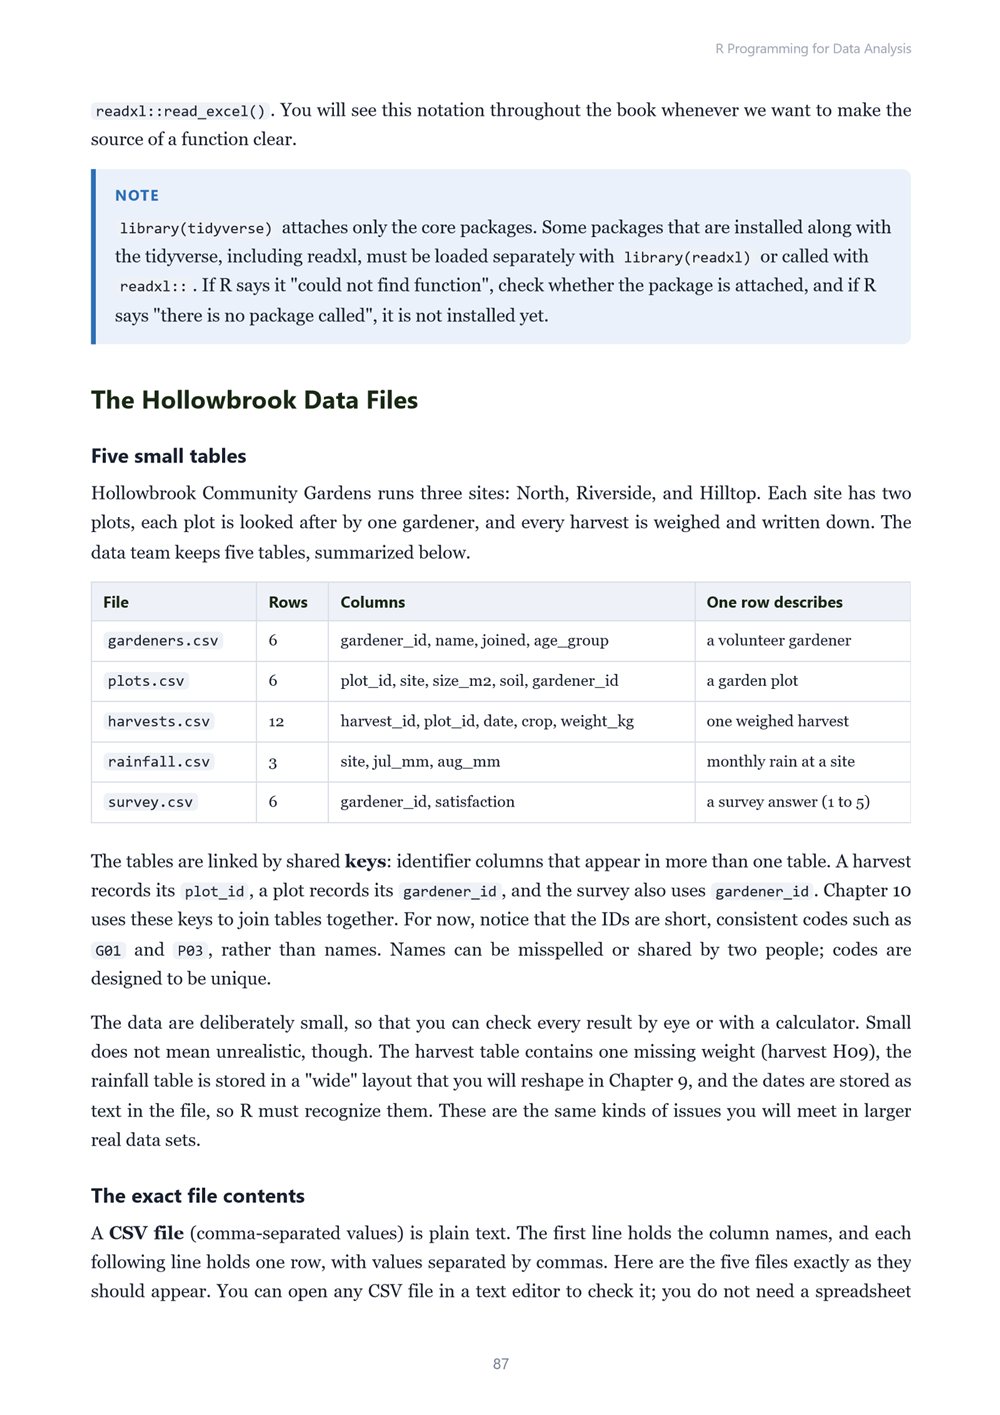
Every idea is introduced with a small, concrete example you can check by eye. Throughout the book we help the volunteer data team of Hollowbrook Community Gardens — six gardeners, six plots, a season of harvests, rainfall, and a satisfaction survey — clean, combine, summarize, visualize, and model their data, and finally publish their annual report. Statistical results are explained honestly, including when a sample is simply too small to support a confident conclusion.
- 445 pages · 28 chapters + 4 appendices
- Written for beginners — no programming experience required
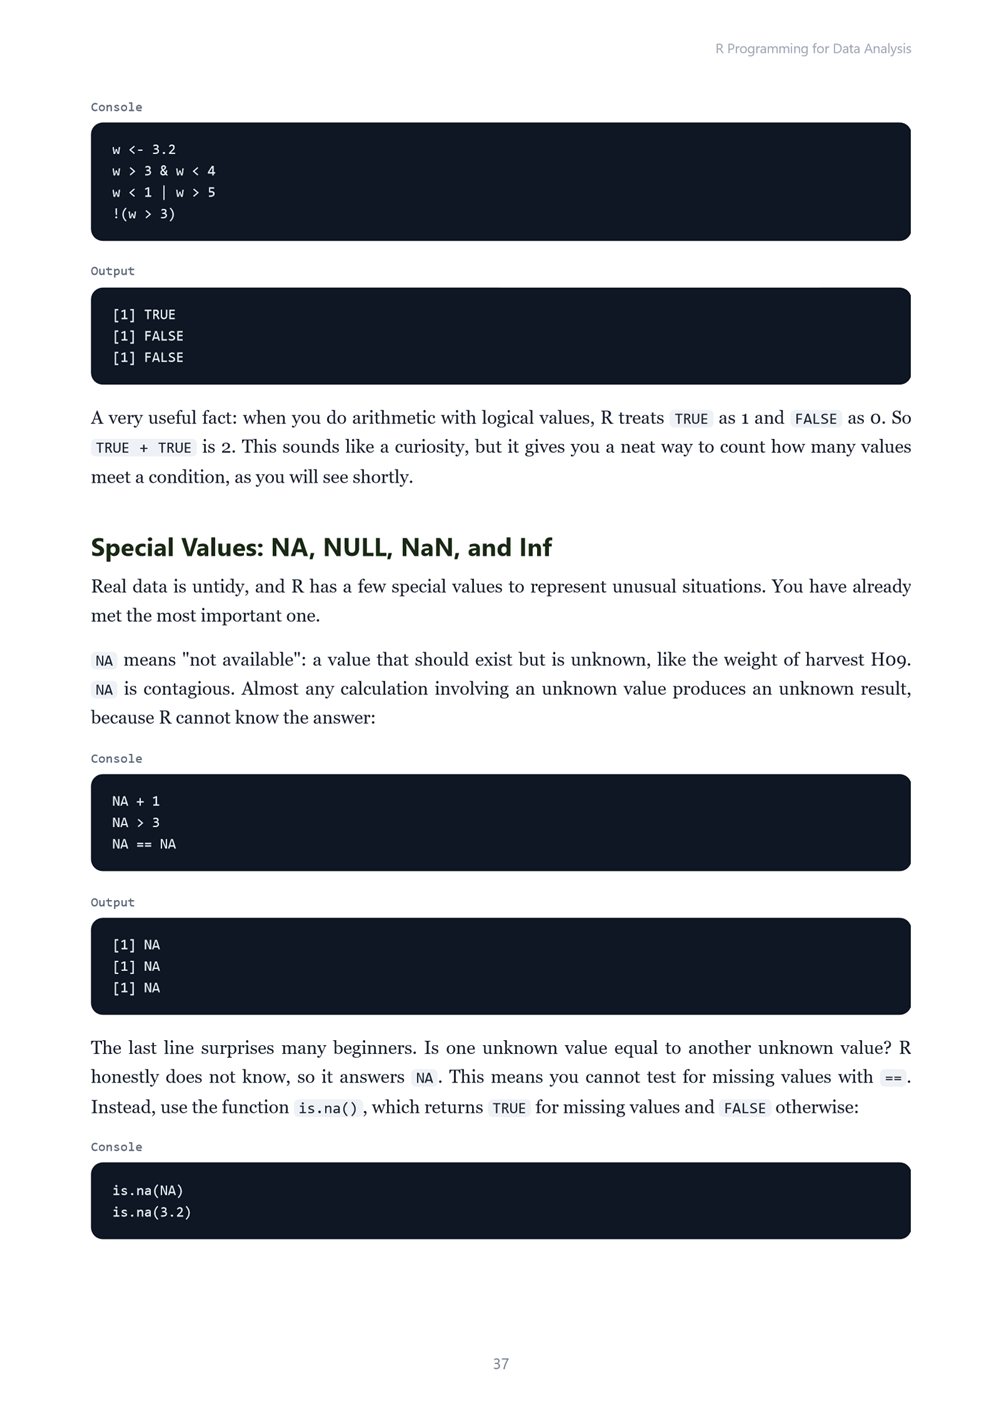
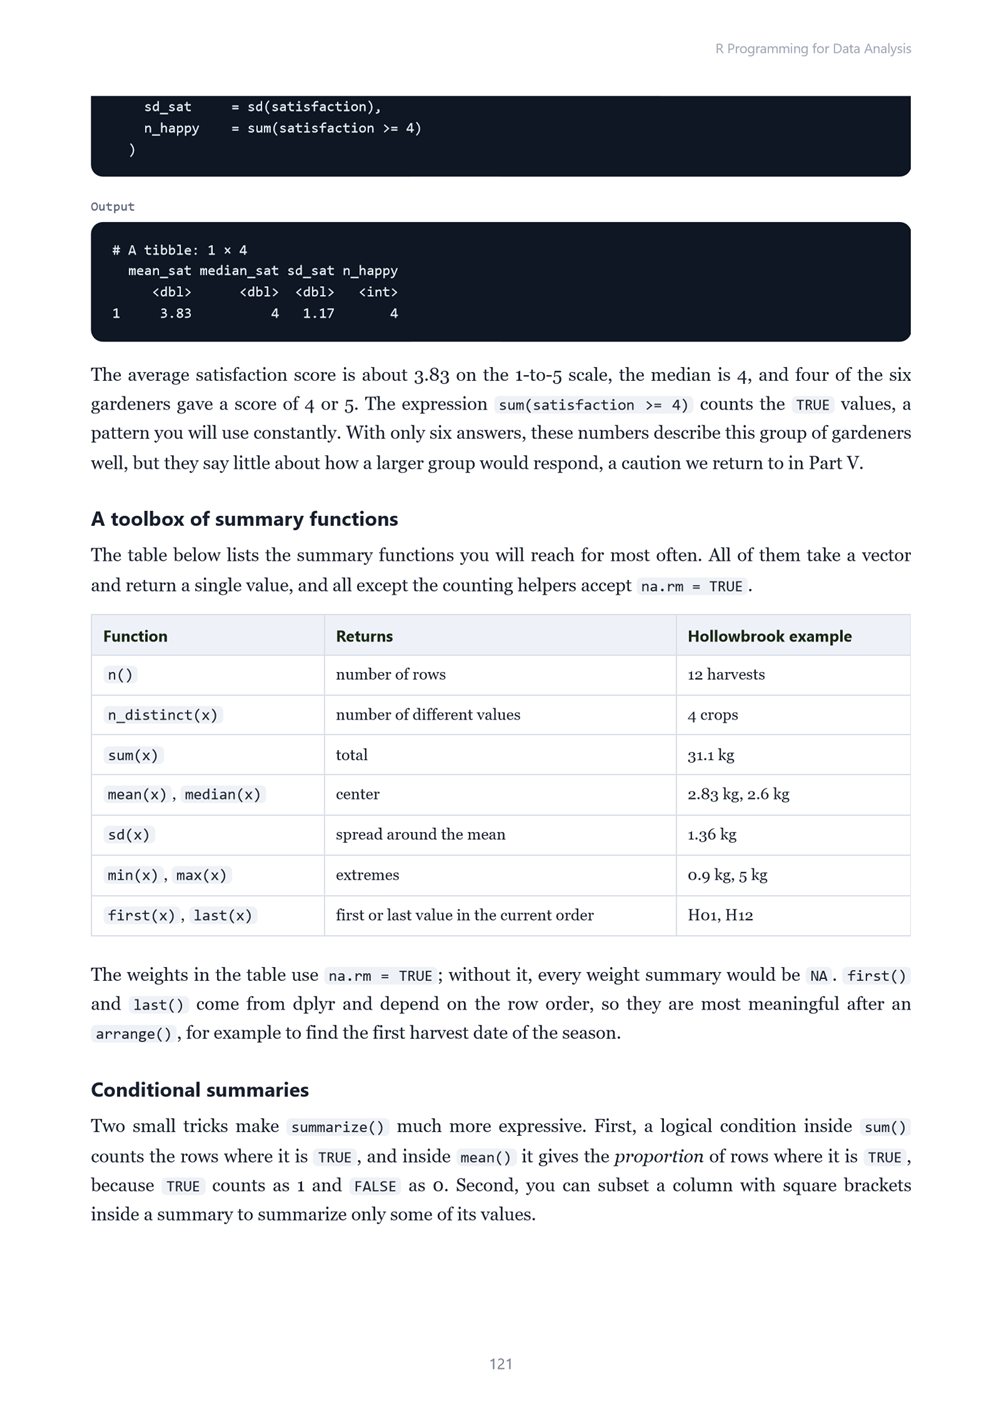
- R fundamentals: values, vectors, factors, lists, data frames, control flow, and functions
- A reproducible project workflow, importing CSV and Excel data with readr and readxl
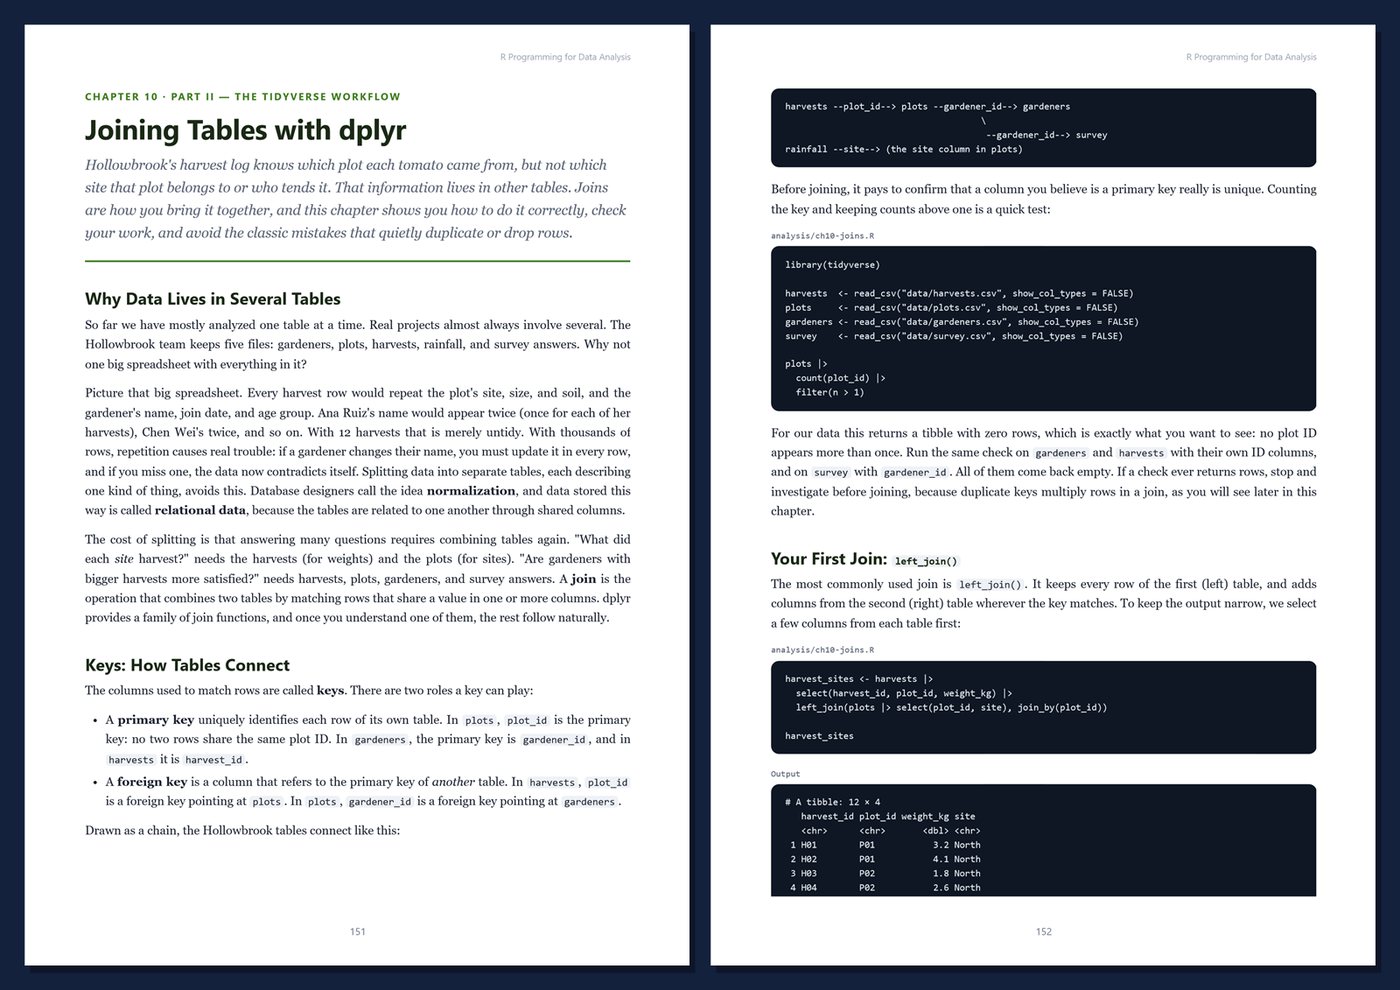
- dplyr for filtering, sorting, transforming, grouping, summarizing, and joining tables
- tidyr for tidy data and reshaping; stringr, forcats, and lubridate for text, categories, and dates
- Handling missing values, cleaning and validating data, and iteration with purrr
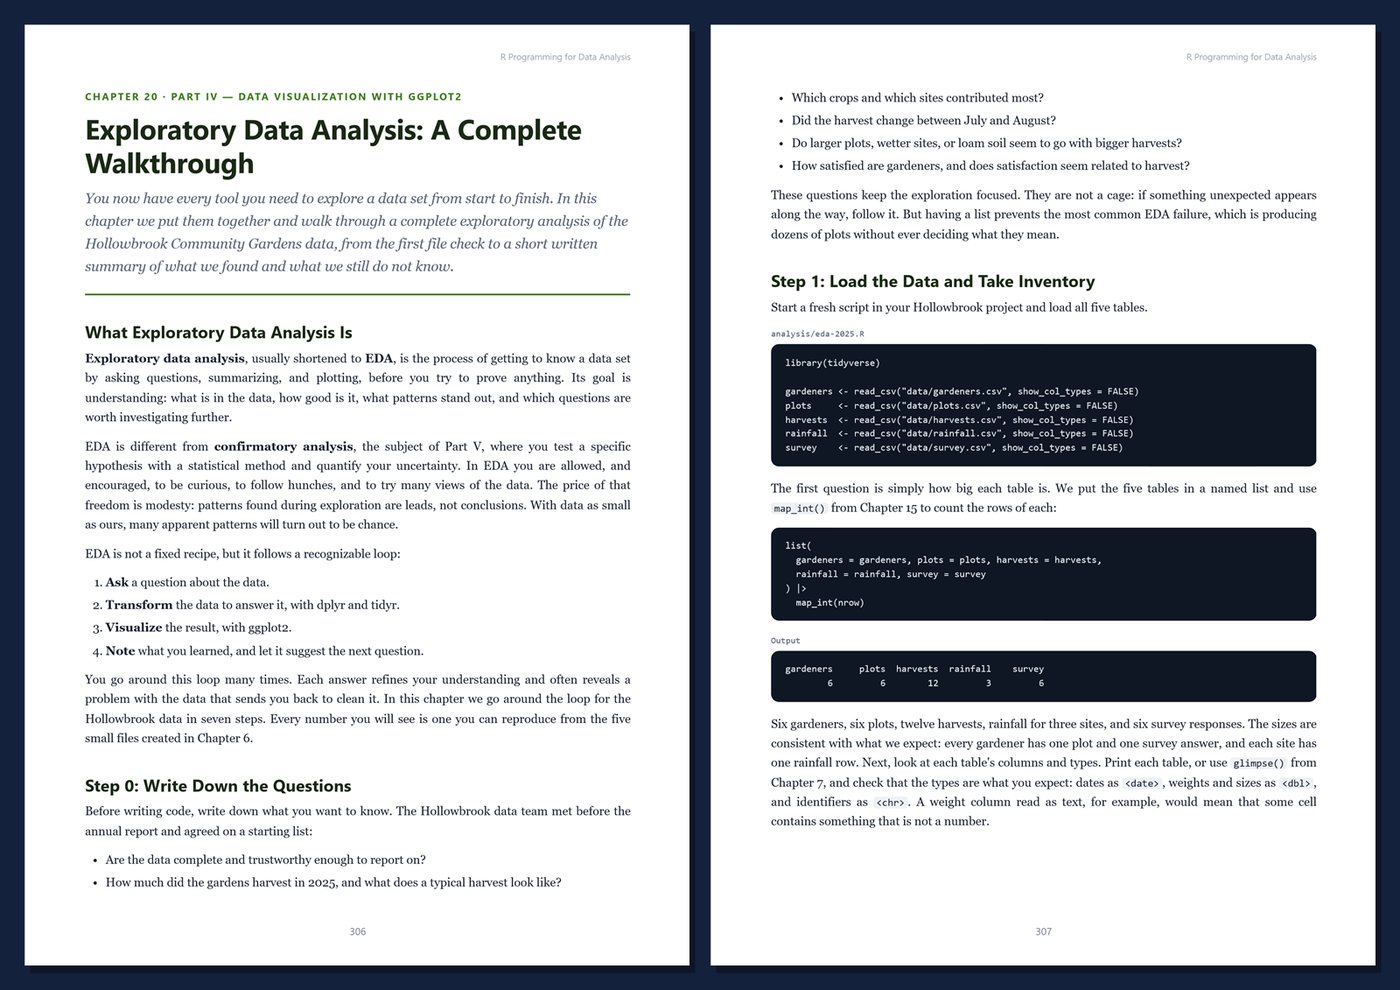
- ggplot2 from the grammar of graphics to polished, publication-ready figures, plus a full exploratory analysis
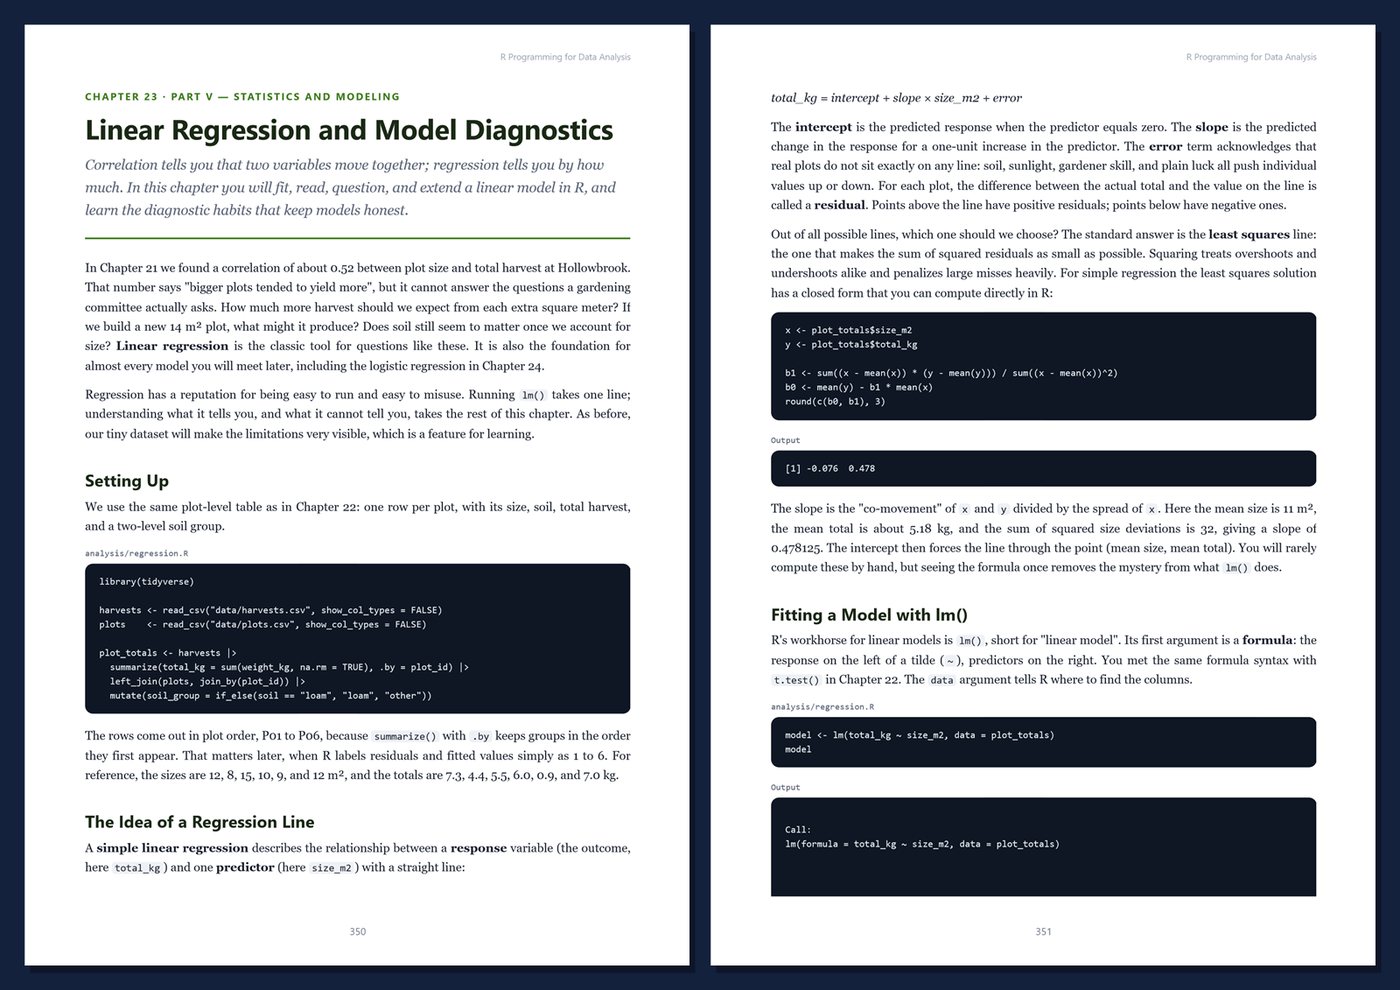
- Descriptive statistics, confidence intervals, hypothesis tests, linear and logistic regression, and an introduction to tidymodels
- Reproducible reports with Quarto, better code with testthat and packages, and interactive dashboards with Shiny
- A cheat sheet, function reference, reusable templates, and an analysis checklist
Table Of Contents
Part I — Getting Started with R
- Ch 1 · Why R? Data Analysis, Statistics, and the R Ecosystem
- Ch 2 · Installing R and an IDE, and Your First Session
- Ch 3 · R Basics: Values, Types, Vectors, and Arithmetic
- Ch 4 · Data Structures: Factors, Lists, Matrices, and Data Frames
- Ch 5 · Control Flow and Writing Your Own Functions
Part II — The Tidyverse Workflow
- Ch 6 · Projects, Packages, and Importing Data with readr and readxl
- Ch 7 · Transforming Data with dplyr: filter, arrange, select, and mutate
- Ch 8 · Grouping and Summarizing: summarize, .by, Counts, and Window Functions
- Ch 9 · Tidy Data and Reshaping with tidyr
- Ch 10 · Joining Tables with dplyr
Part III — Working with Real-World Data
- Ch 11 · Strings and Regular Expressions with stringr
- Ch 12 · Factors and Categorical Data with forcats
- Ch 13 · Dates and Times with lubridate
- Ch 14 · Missing Values, Data Cleaning, and Validation
- Ch 15 · Iteration and Functional Programming with purrr
Part IV — Data Visualization with ggplot2
- Ch 16 · ggplot2 Fundamentals: The Grammar of Graphics
- Ch 17 · Visualizing Distributions, Relationships, and Trends
- Ch 18 · Polishing Plots: Scales, Labels, Themes, and Annotations
- Ch 19 · Facets, Combined Plots, and Exporting Figures
- Ch 20 · Exploratory Data Analysis: A Complete Walkthrough
Part V — Statistics and Modeling
- Ch 21 · Descriptive Statistics and Probability Basics
- Ch 22 · Statistical Inference: Confidence Intervals and Hypothesis Tests
- Ch 23 · Linear Regression and Model Diagnostics
- Ch 24 · Beyond Linear Regression: Logistic Regression and an Introduction to tidymodels
Part VI — Communicating and Scaling Up
- Ch 25 · Reproducible Reports with Quarto
- Ch 26 · Writing Better R Code: Functions, Debugging, Testing, and Packages
- Ch 27 · Interactive Dashboards with Shiny
- Ch 28 · Case Study: The Hollowbrook Community Gardens Annual Report
Appendices
- App A · R and Tidyverse Cheat Sheet
- App B · Function Reference and Templates
- App C · Data Analysis Checklist
- App D · Glossary
WHO IT IS FOR
Beginners who want to learn programming through data analysis, spreadsheet users ready to make their work faster and reproducible, students in statistics, science, social science, or business courses that use R, and programmers from other languages who need a clear path into R and the tidyverse.
FORMAT
PDF (A4), 445 pages, English, clickable table of contents and PDF bookmarks. Plots are described in the text; run the code to see each figure. 1st Edition, 2026. Published by thenexbooks.
This book is independent and is not affiliated with or endorsed by the R Foundation, the R Core Team, or Posit Software, PBC. All product names are trademarks of their respective owners.
Book details
| Detail | |
|---|---|
| Pages | 445 |
| Format | PDF (A4) |
| Language | English |
| Level | Beginner to Intermediate |
| Edition | 1st Edition, 2026 |
| Download on this site | Free sample, first 20 pages (PDF) |
| Publisher | thenexbooks |
Files you get
No reviews yet. Only buyers can review.
More from thenexbooks